

Solo & creator
The monthly two minutes
A monthly summary template you run once, read once, and act on — the discipline of reporting without the afternoon it used to cost.
📈 Social media reporting
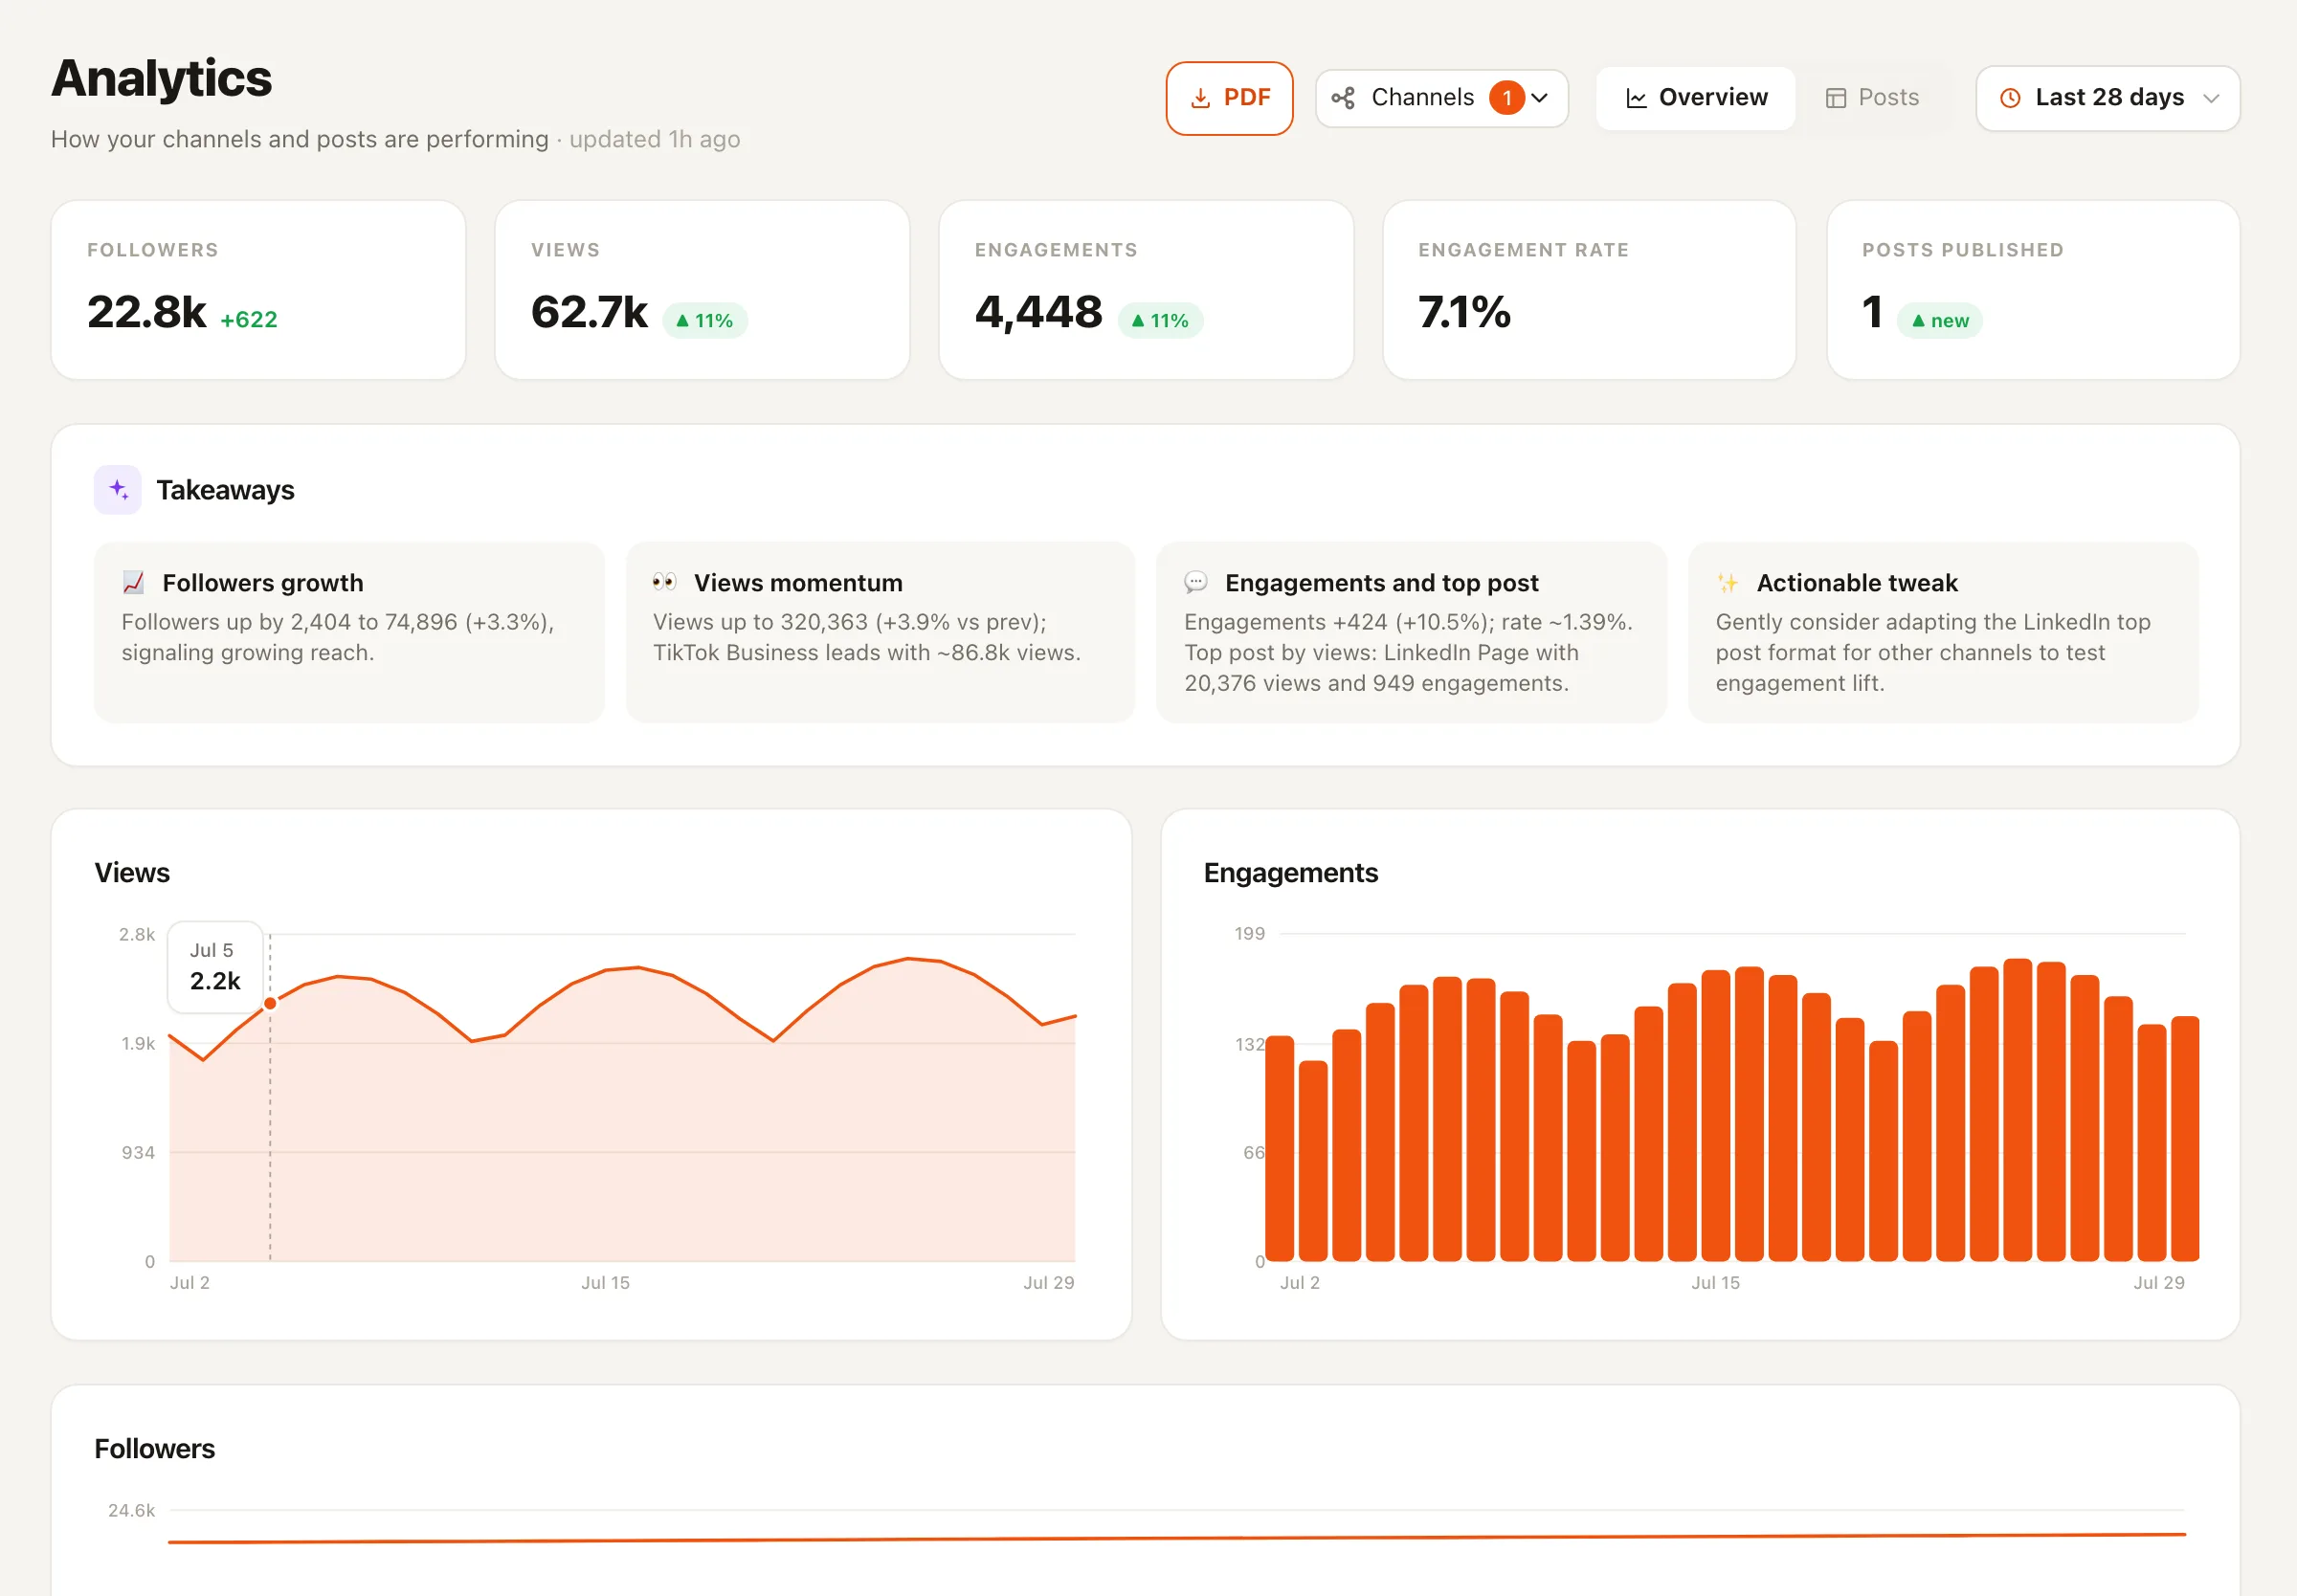
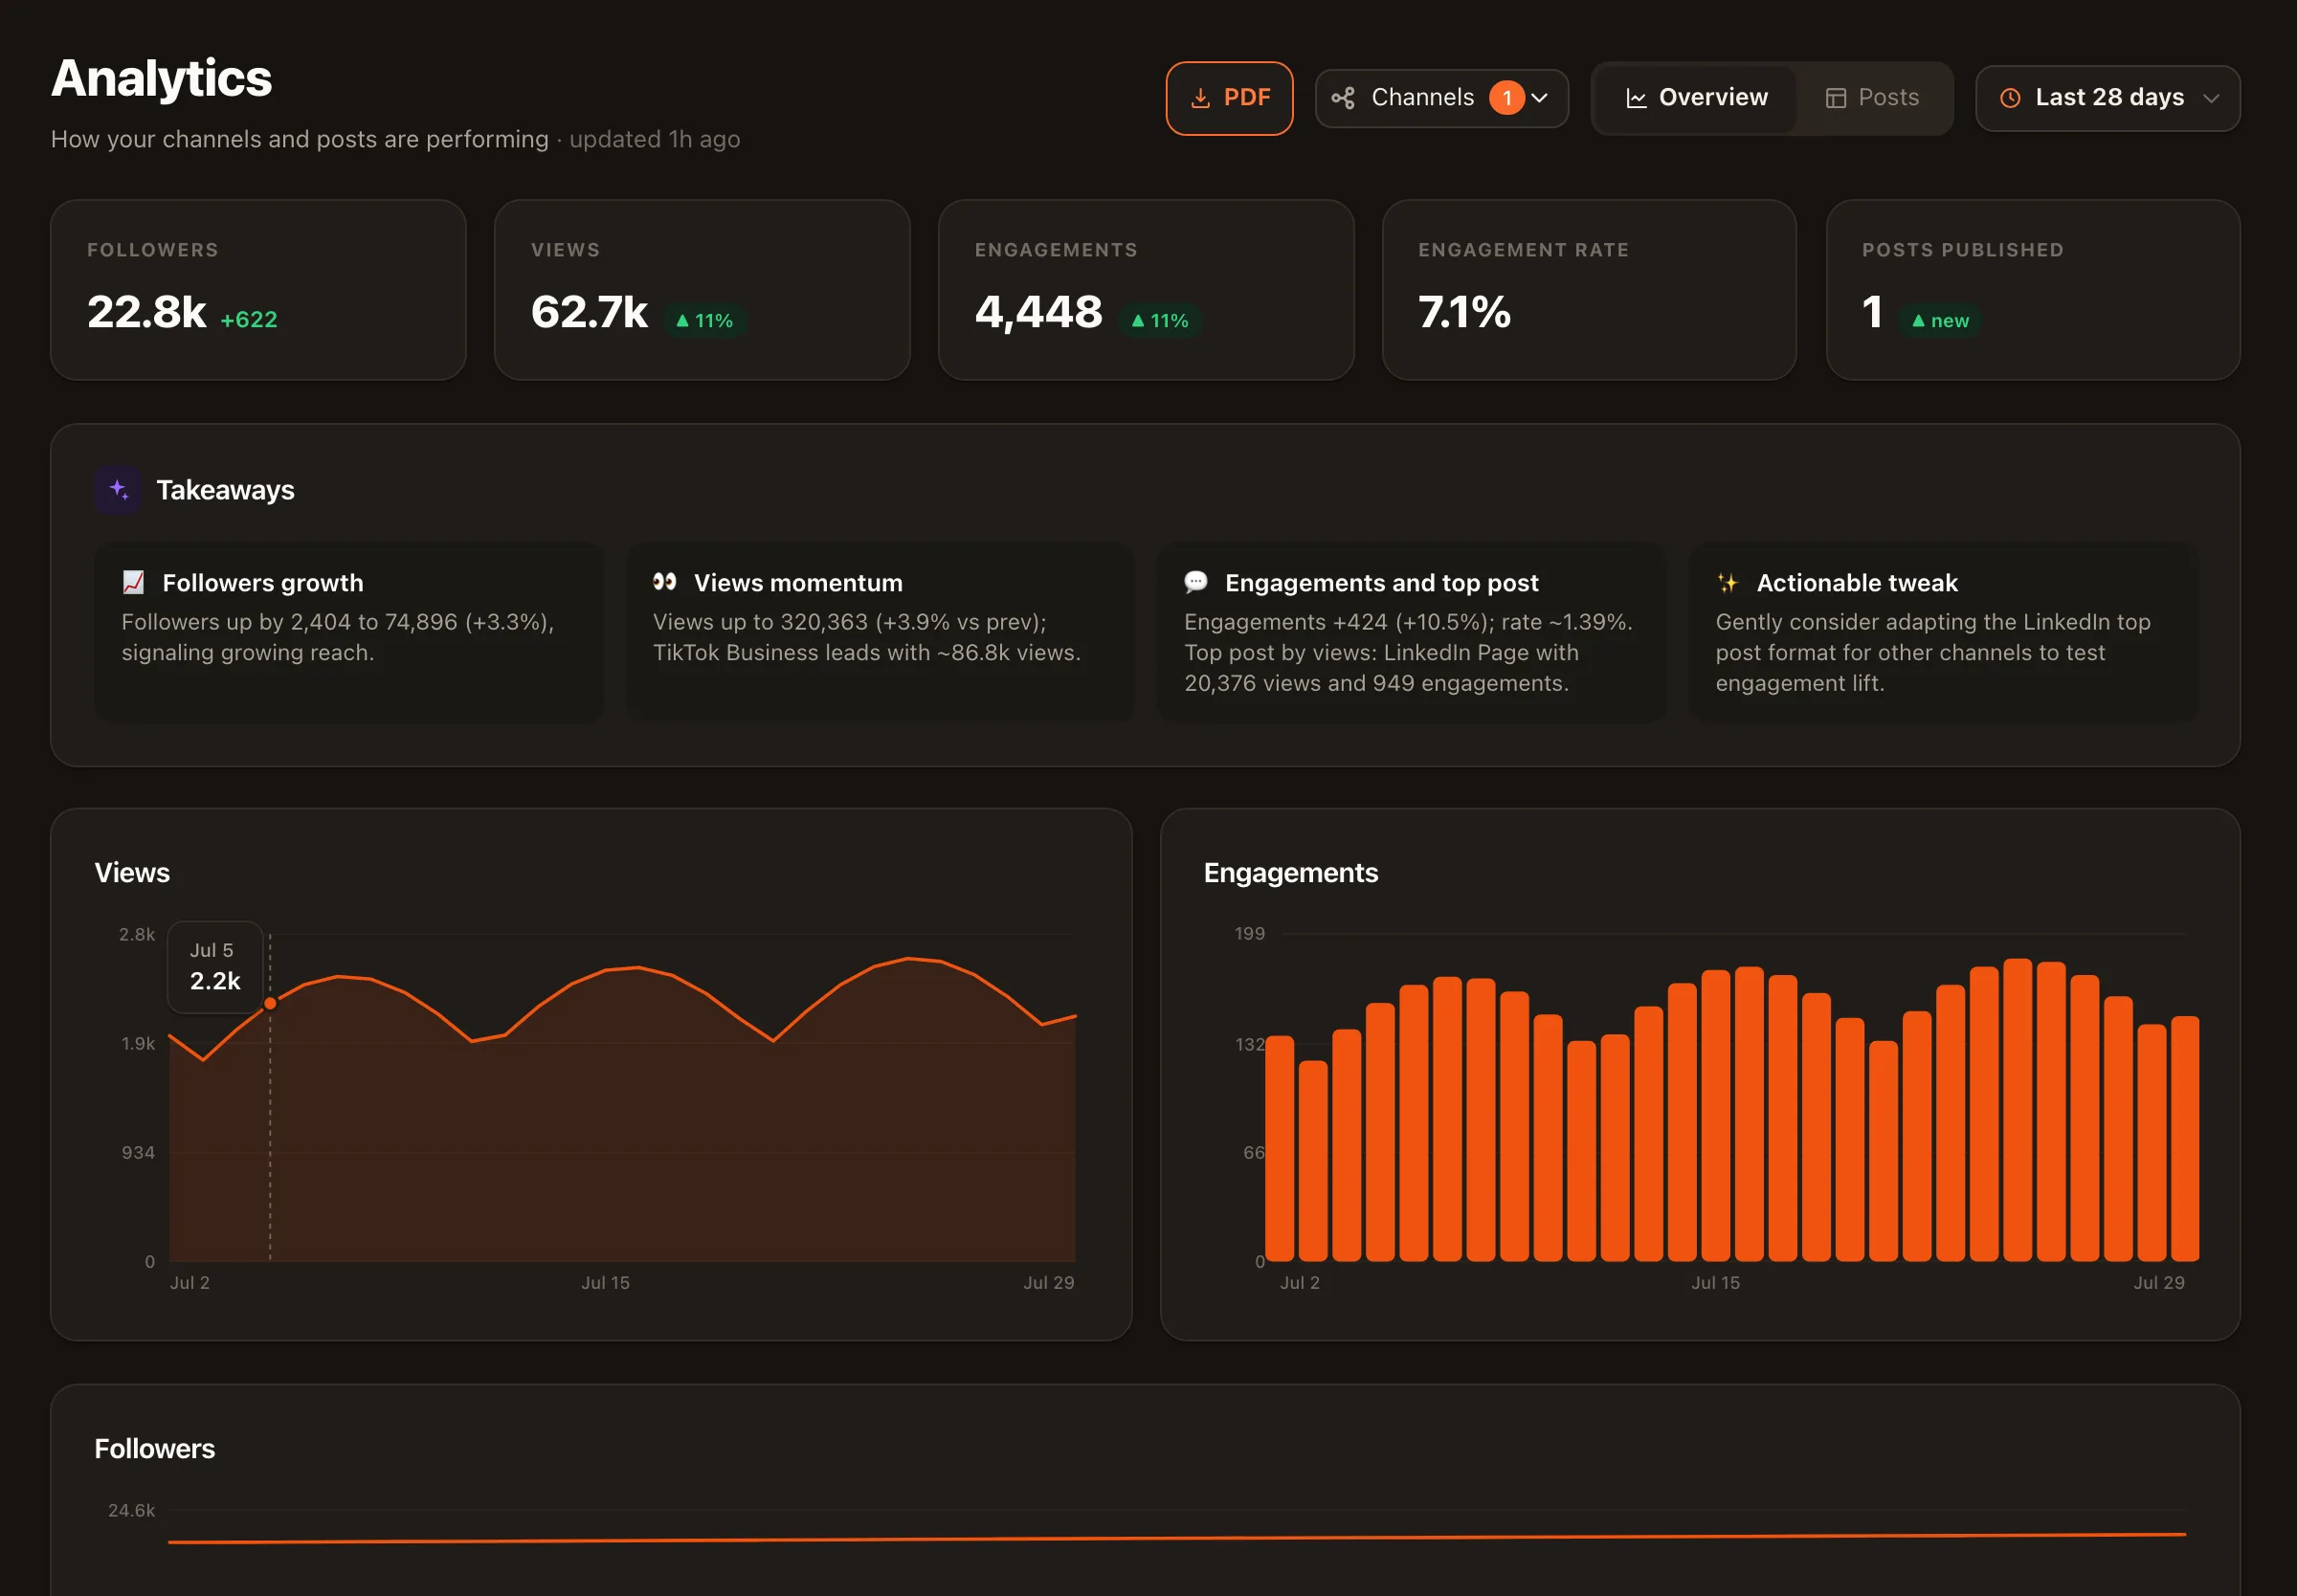
A dashboard answers “what are the numbers?” A report answers “so what do we do?” Nimply is a social media reporting tool built around that difference: YouTube-first channel and video metrics underneath, and a narrative layer of 26 prompt templates on top — paste in your numbers and they draft something a client, or your future self, actually reads.
Anatomy of a report
Every good social media report — monthly summary, client deliverable, post-mortem — has the same skeleton. Nimply’s report templates are built around it.
Monthly report · draft
IllustrativeHeadline takeaway
One sentence a busy client reads first — and could stop at.
“Shorts drove this month's growth; long-form held steady.”
What moved
The three or four metrics that actually changed, with direction.
Views · watch time · subscribers · top videos — vs. last period.
Why it moved
The narrative link between what you published and what happened.
“The two tutorial uploads outperformed; the vlog format lagged.”
Next actions
What next month's calendar should do differently because of this.
Double down · retire · test — each tied to a finding above.
A skeleton, not a sample — the numbers in your reports come from your connected channels, never from us.
Most reporting fails at the hand-off: the person receiving it doesn’t know what they’re supposed to conclude. Leading with the takeaway forces the report to have one. The “what moved” section earns trust with real numbers, “why” connects those numbers to the content you shipped, and “next actions” is the part that changes next month’s calendar. If a section doesn’t feed a decision, it’s decoration.
The 26 analytics templates in Nimply’s library each walk a variation of this skeleton — so the structure is consistent even when the month isn’t.
The data layer
We’d rather be honest than impressive: Nimply’s analytics depth is YouTube-first right now, with more platforms arriving as approvals land. If YouTube is a serious channel for you, the depth is real today — see how it fits into full YouTube channel management.
Views, watch time, and subscriber movement for your connected YouTube channel — tracked over time, not screenshotted from Studio.
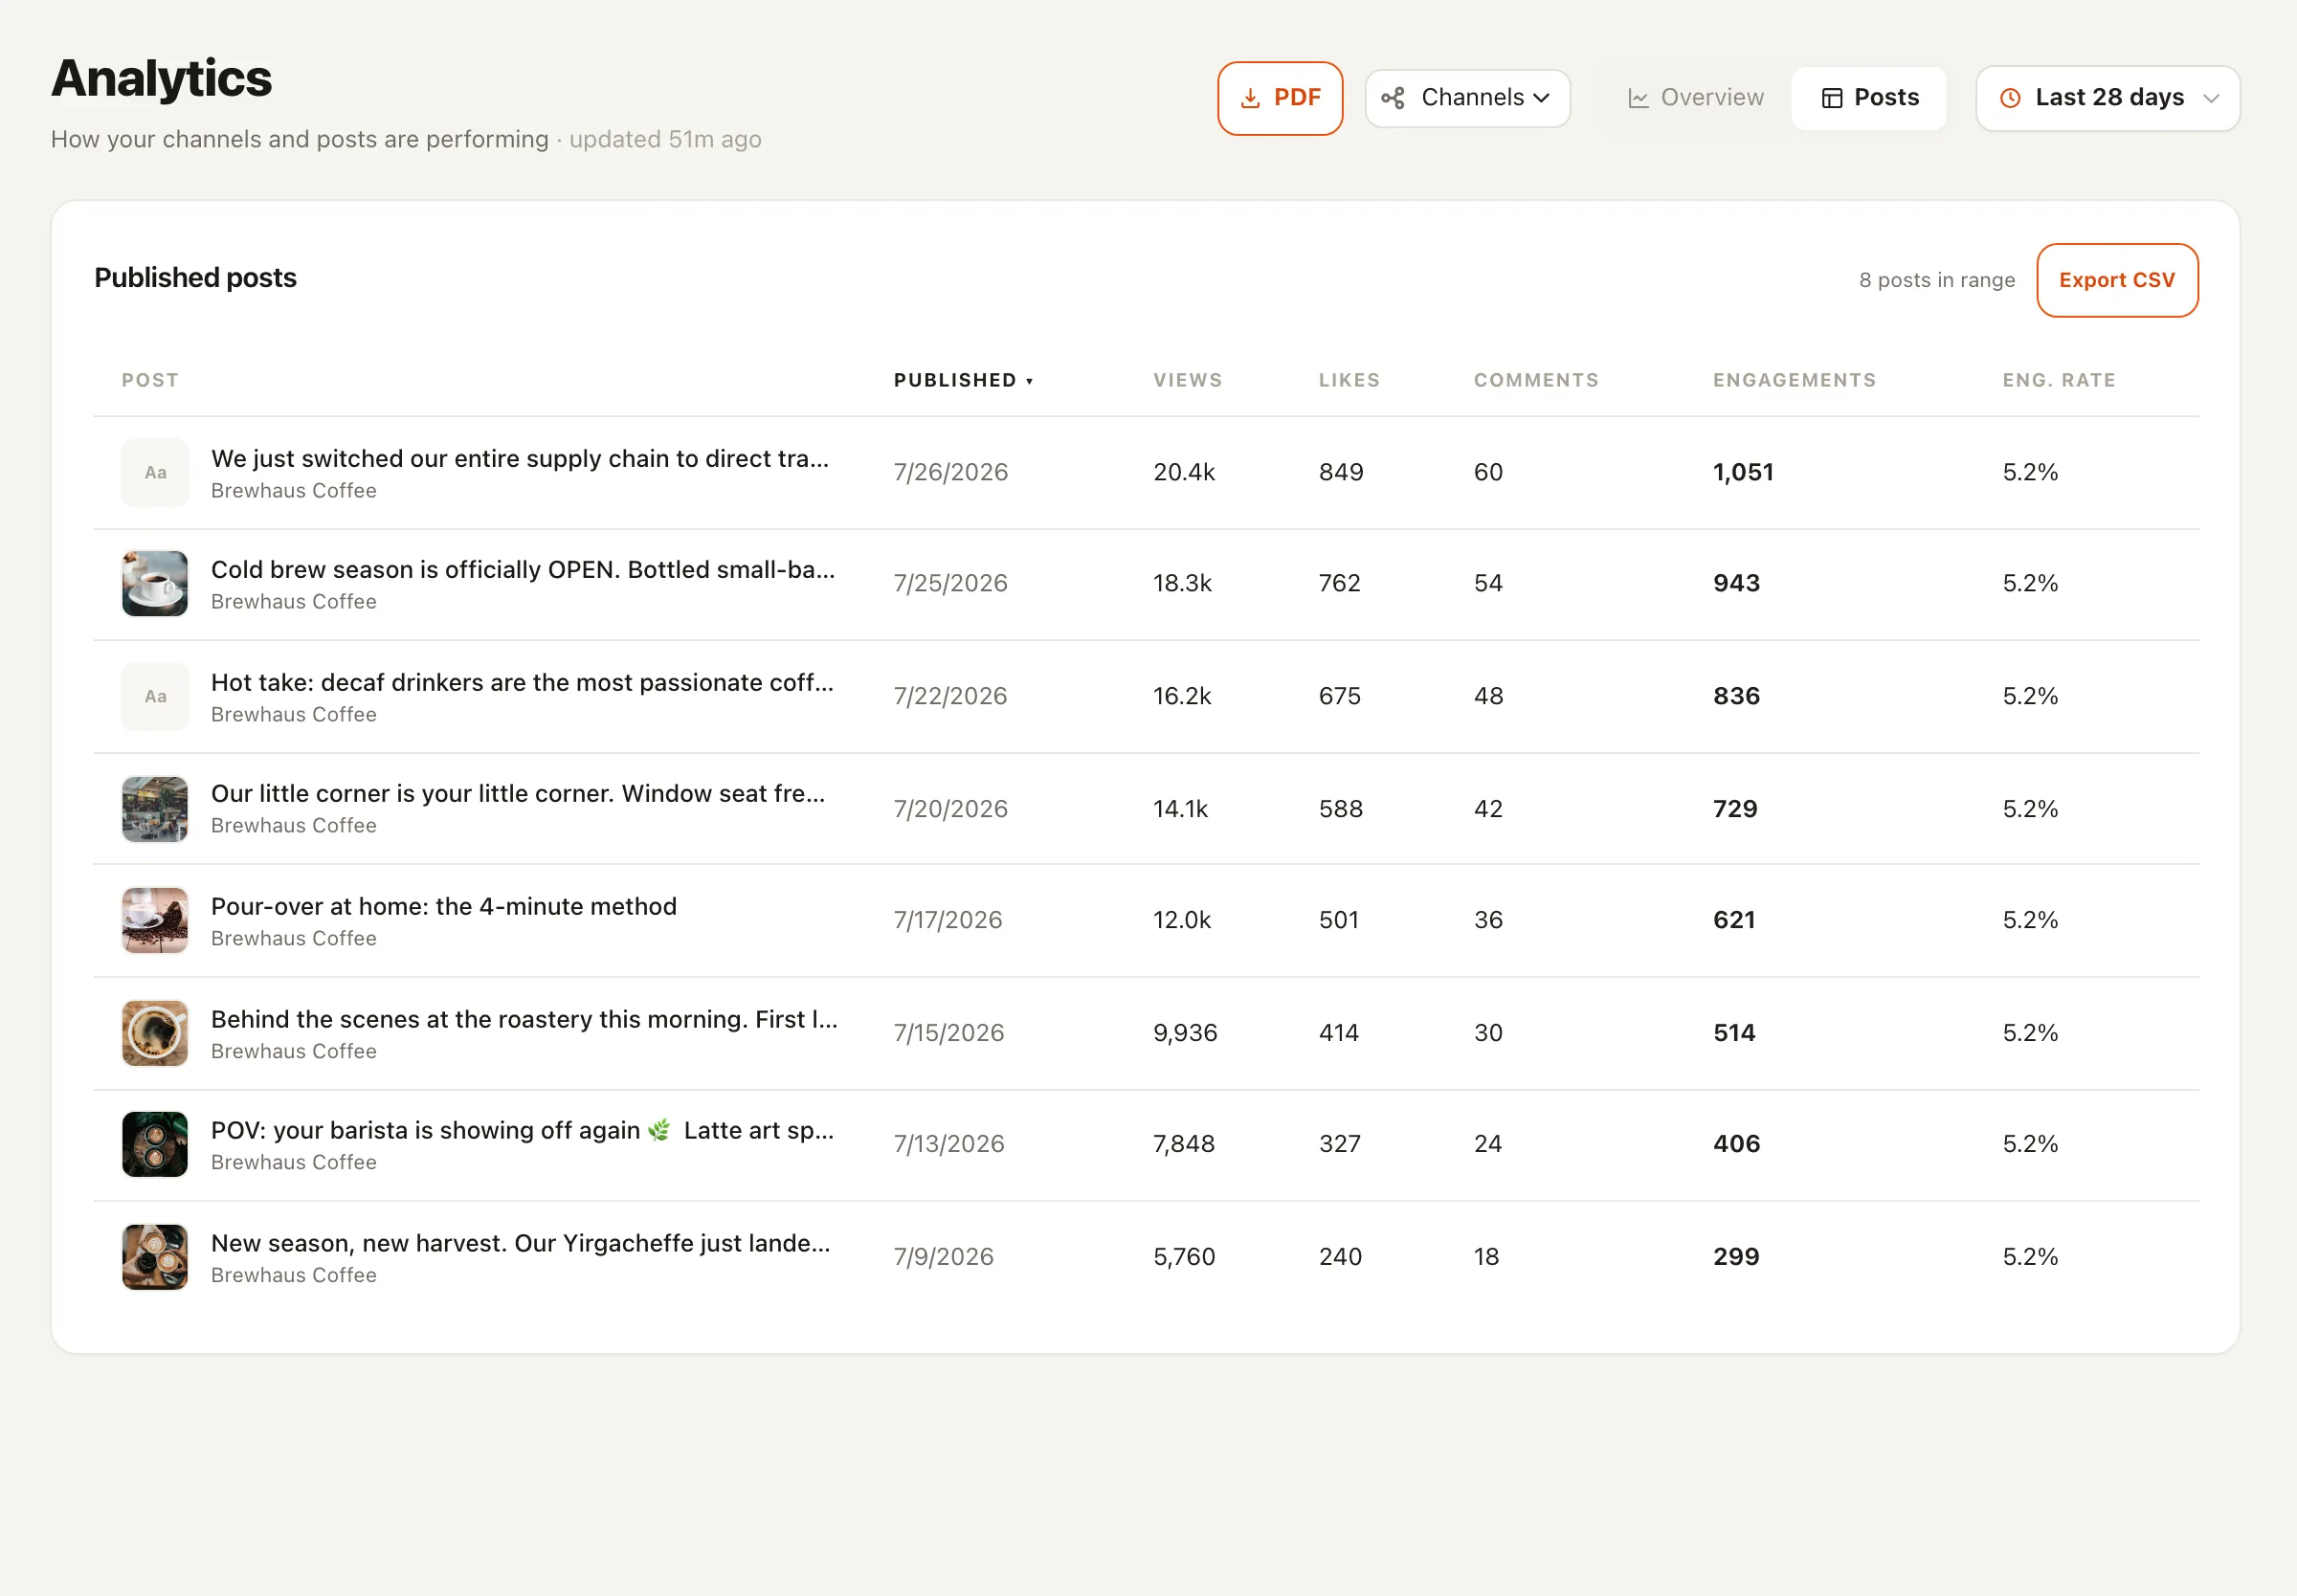
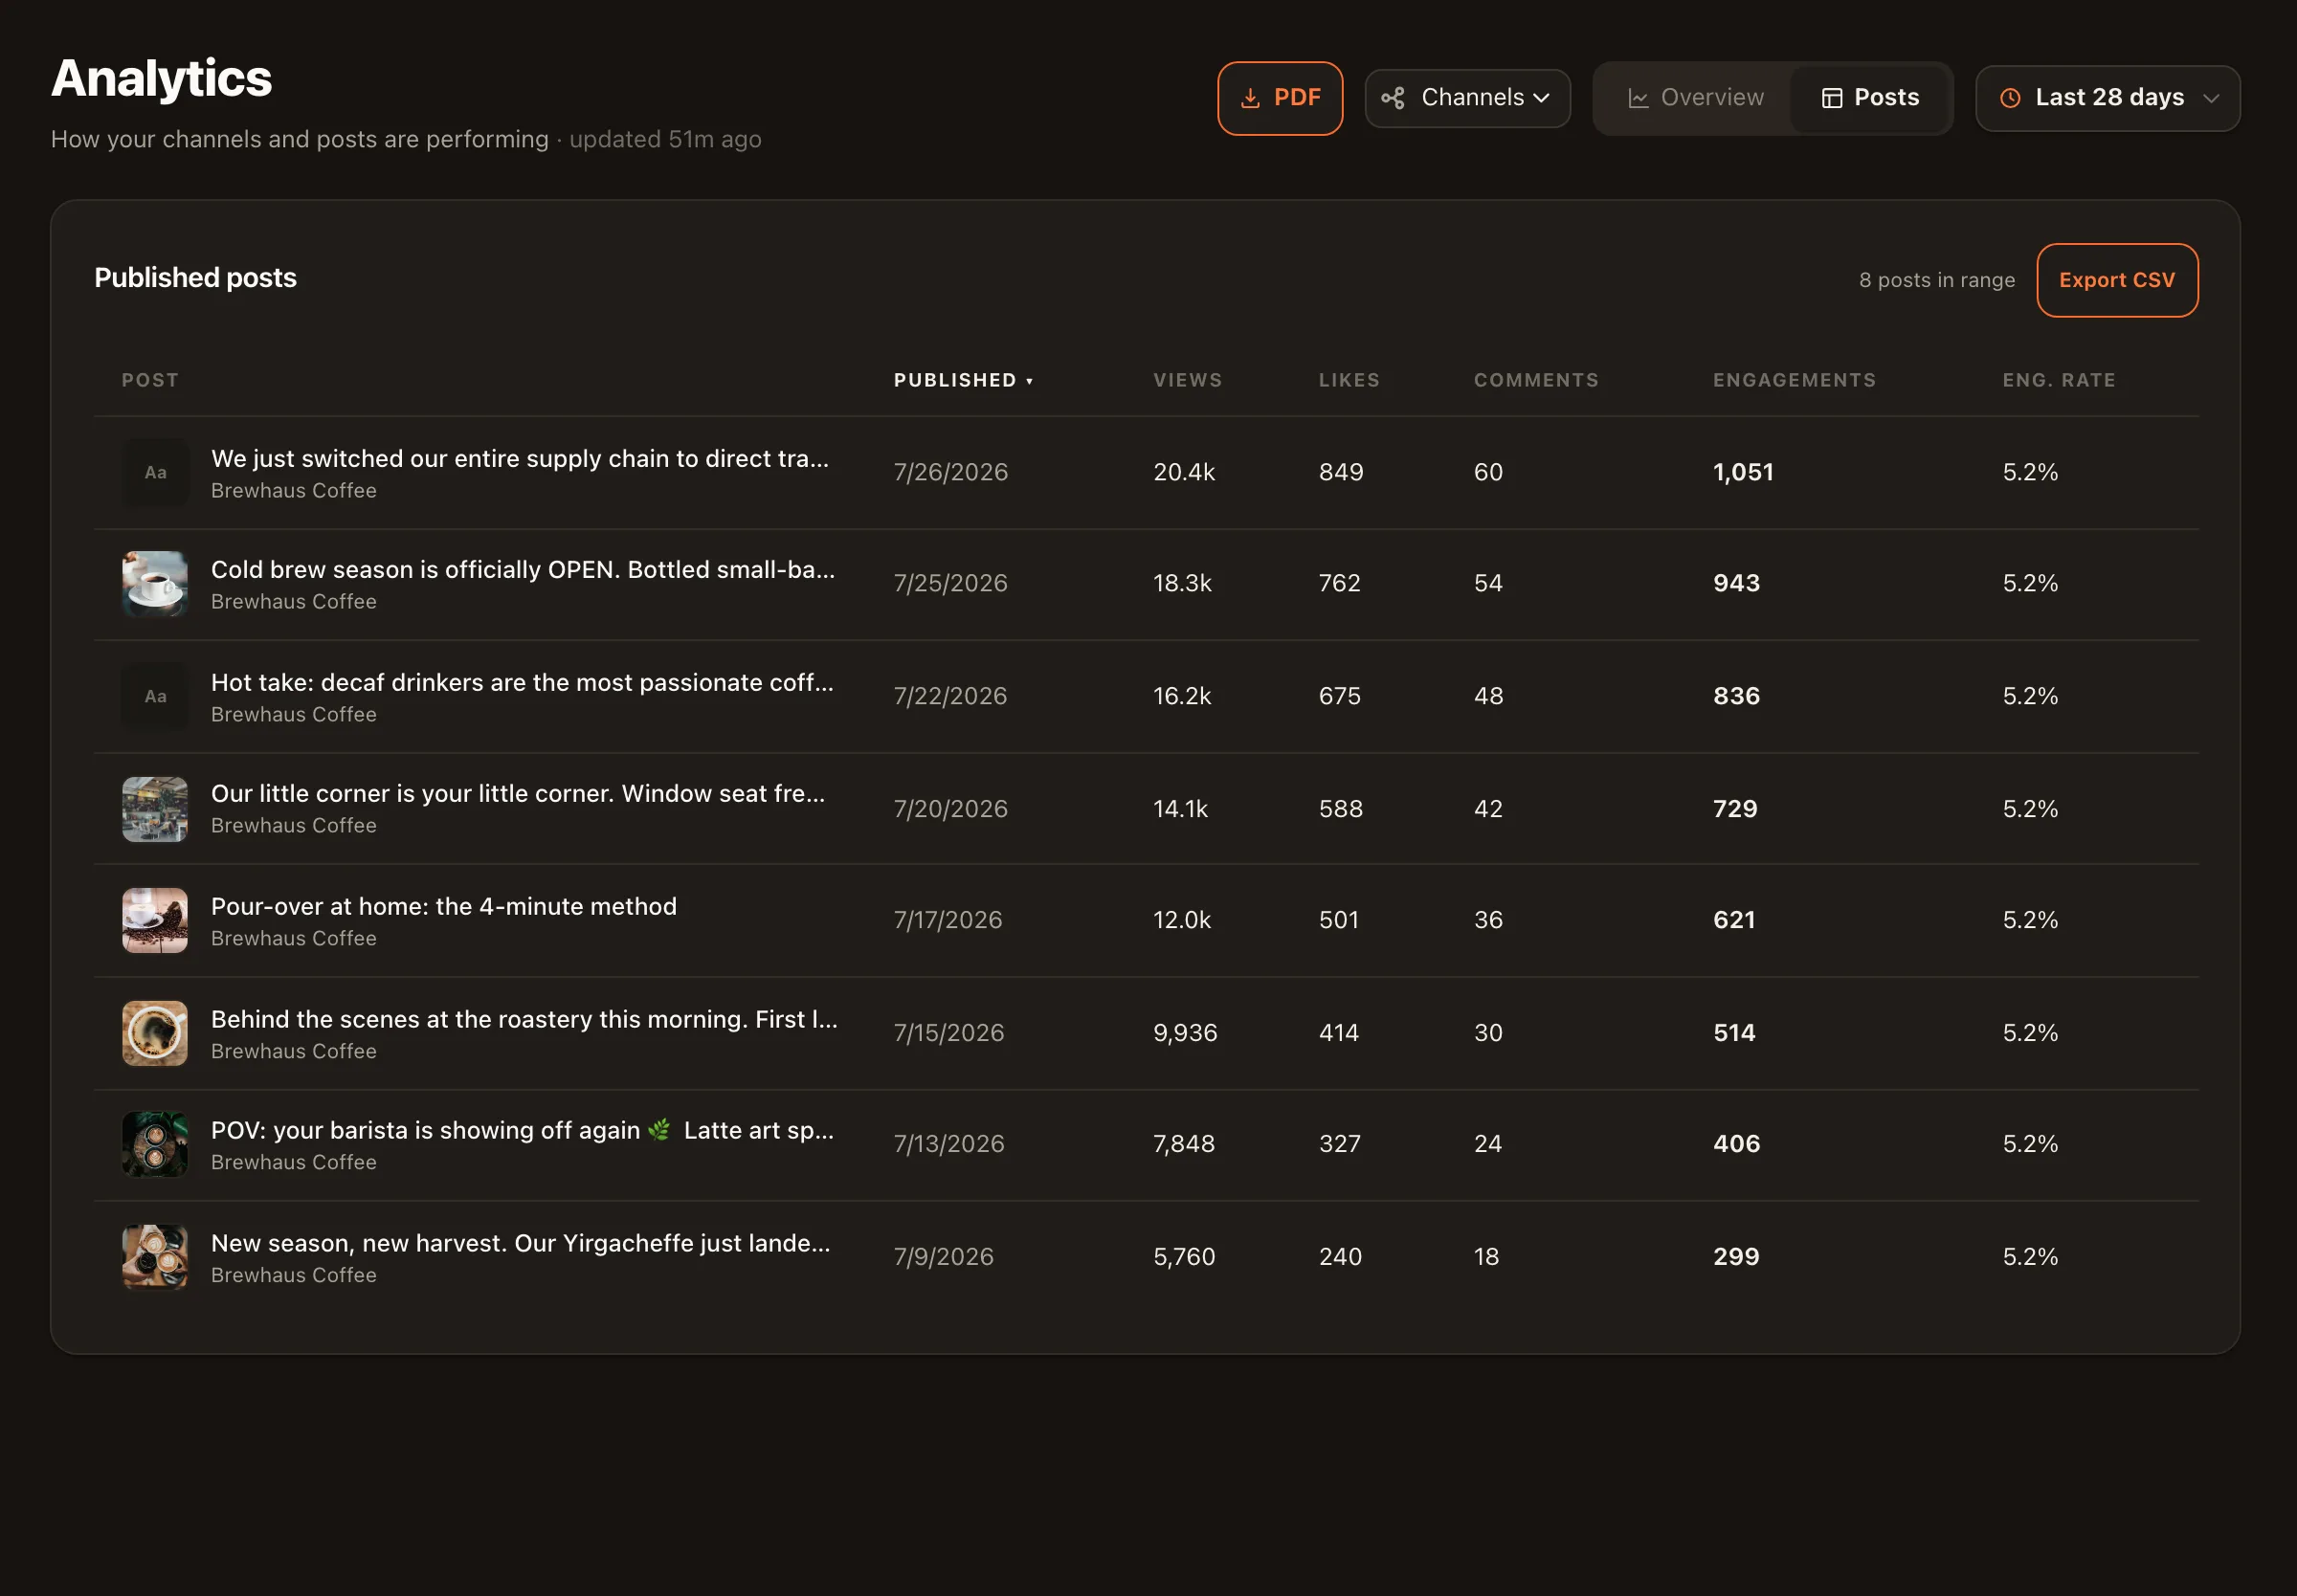
See which uploads carried the month and which lagged — the raw material for the 'why it moved' section of any report.
Meta approved the insights permissions on 7 September — a Page or Instagram account connected before then needs reconnecting once to pick them up. LinkedIn is the last network without a dashboard, pending LinkedIn's own approval; we'll say a platform is supported only when it actually is.
The narrative layer
The analytics template library holds 26 report prompts — monthly summaries, client reports, post-mortems, and more. Each turns the metrics from your platforms into a written narrative. The data is yours; the structure is reusable.
Solo & creator
A monthly summary template you run once, read once, and act on — the discipline of reporting without the afternoon it used to cost.
Agencies
One workspace per client keeps channels and metrics cleanly separated; the same template run per workspace keeps the deliverable consistent. Built for how agencies actually operate.
Teams
When a campaign ends, a post-mortem template asks the uncomfortable questions in a fixed order — so the answer becomes next quarter’s plan, not a shrug.
YouTube-first, honestly stated: channel metrics (views, watch time, subscribers) and per-video performance are live in the product now. Facebook and Instagram insights are live too (Meta approved the permissions on 7 September — reconnect the channel once), with LinkedIn the last network still to land. Profile and post metrics tracking exists as the foundation underneath, but YouTube is where the depth is today.
The template library includes 26 analytics prompt templates — monthly summaries, client reports, post-mortems, and more. Each one is a structured prompt with variables you fill in: paste your platform numbers and it drafts the written narrative — what happened, why it likely happened, and what to do next. They don't auto-pull metrics from your connected channels; you supply the figures. Browse them at /templates/analytics.
From your own channels, with you in the loop. Nimply's built-in analytics are YouTube-first today — channel and video metrics synced into the product — and for other platforms you pull the numbers from their native dashboards. Either way, you paste the figures into the template: the narrative layer never invents numbers, and anything you can't trace back to your channel data doesn't belong in the report.
Yes — that's a core use. Each client lives in their own workspace with their own connected channels, so metrics never blur across accounts. You run the same report template against each workspace, and the client-facing narrative comes out consistent month after month instead of depending on who wrote it.
No, and it doesn't pretend to be. Native dashboards will always have every metric the platform tracks. Nimply's job is different: pull the metrics that matter into one place and turn them into a report a human reads in two minutes — the takeaway, what moved, why, and what to do about it.
No. The report templates carry the analytical structure for you — they ask the right questions of your numbers. If you can read a paragraph, you can read (and send) the output. Editing before you send is encouraged; the template gets you from blank page to solid draft.
Connect your channels free, pick one of 26 analytics templates, and turn this month's numbers into next month's plan.