

Analytics & insights
Social media analytics that tell you when to post next
Followers, views, and engagement across YouTube, Instagram, Facebook, TikTok, Pinterest, and Threads — in one dashboard, with a best-time-to-post heatmap built from your own history and AI takeaways written from your real numbers. Not a wall of charts you check once and forget.
One picture
Cross-platform performance without the tab-hopping
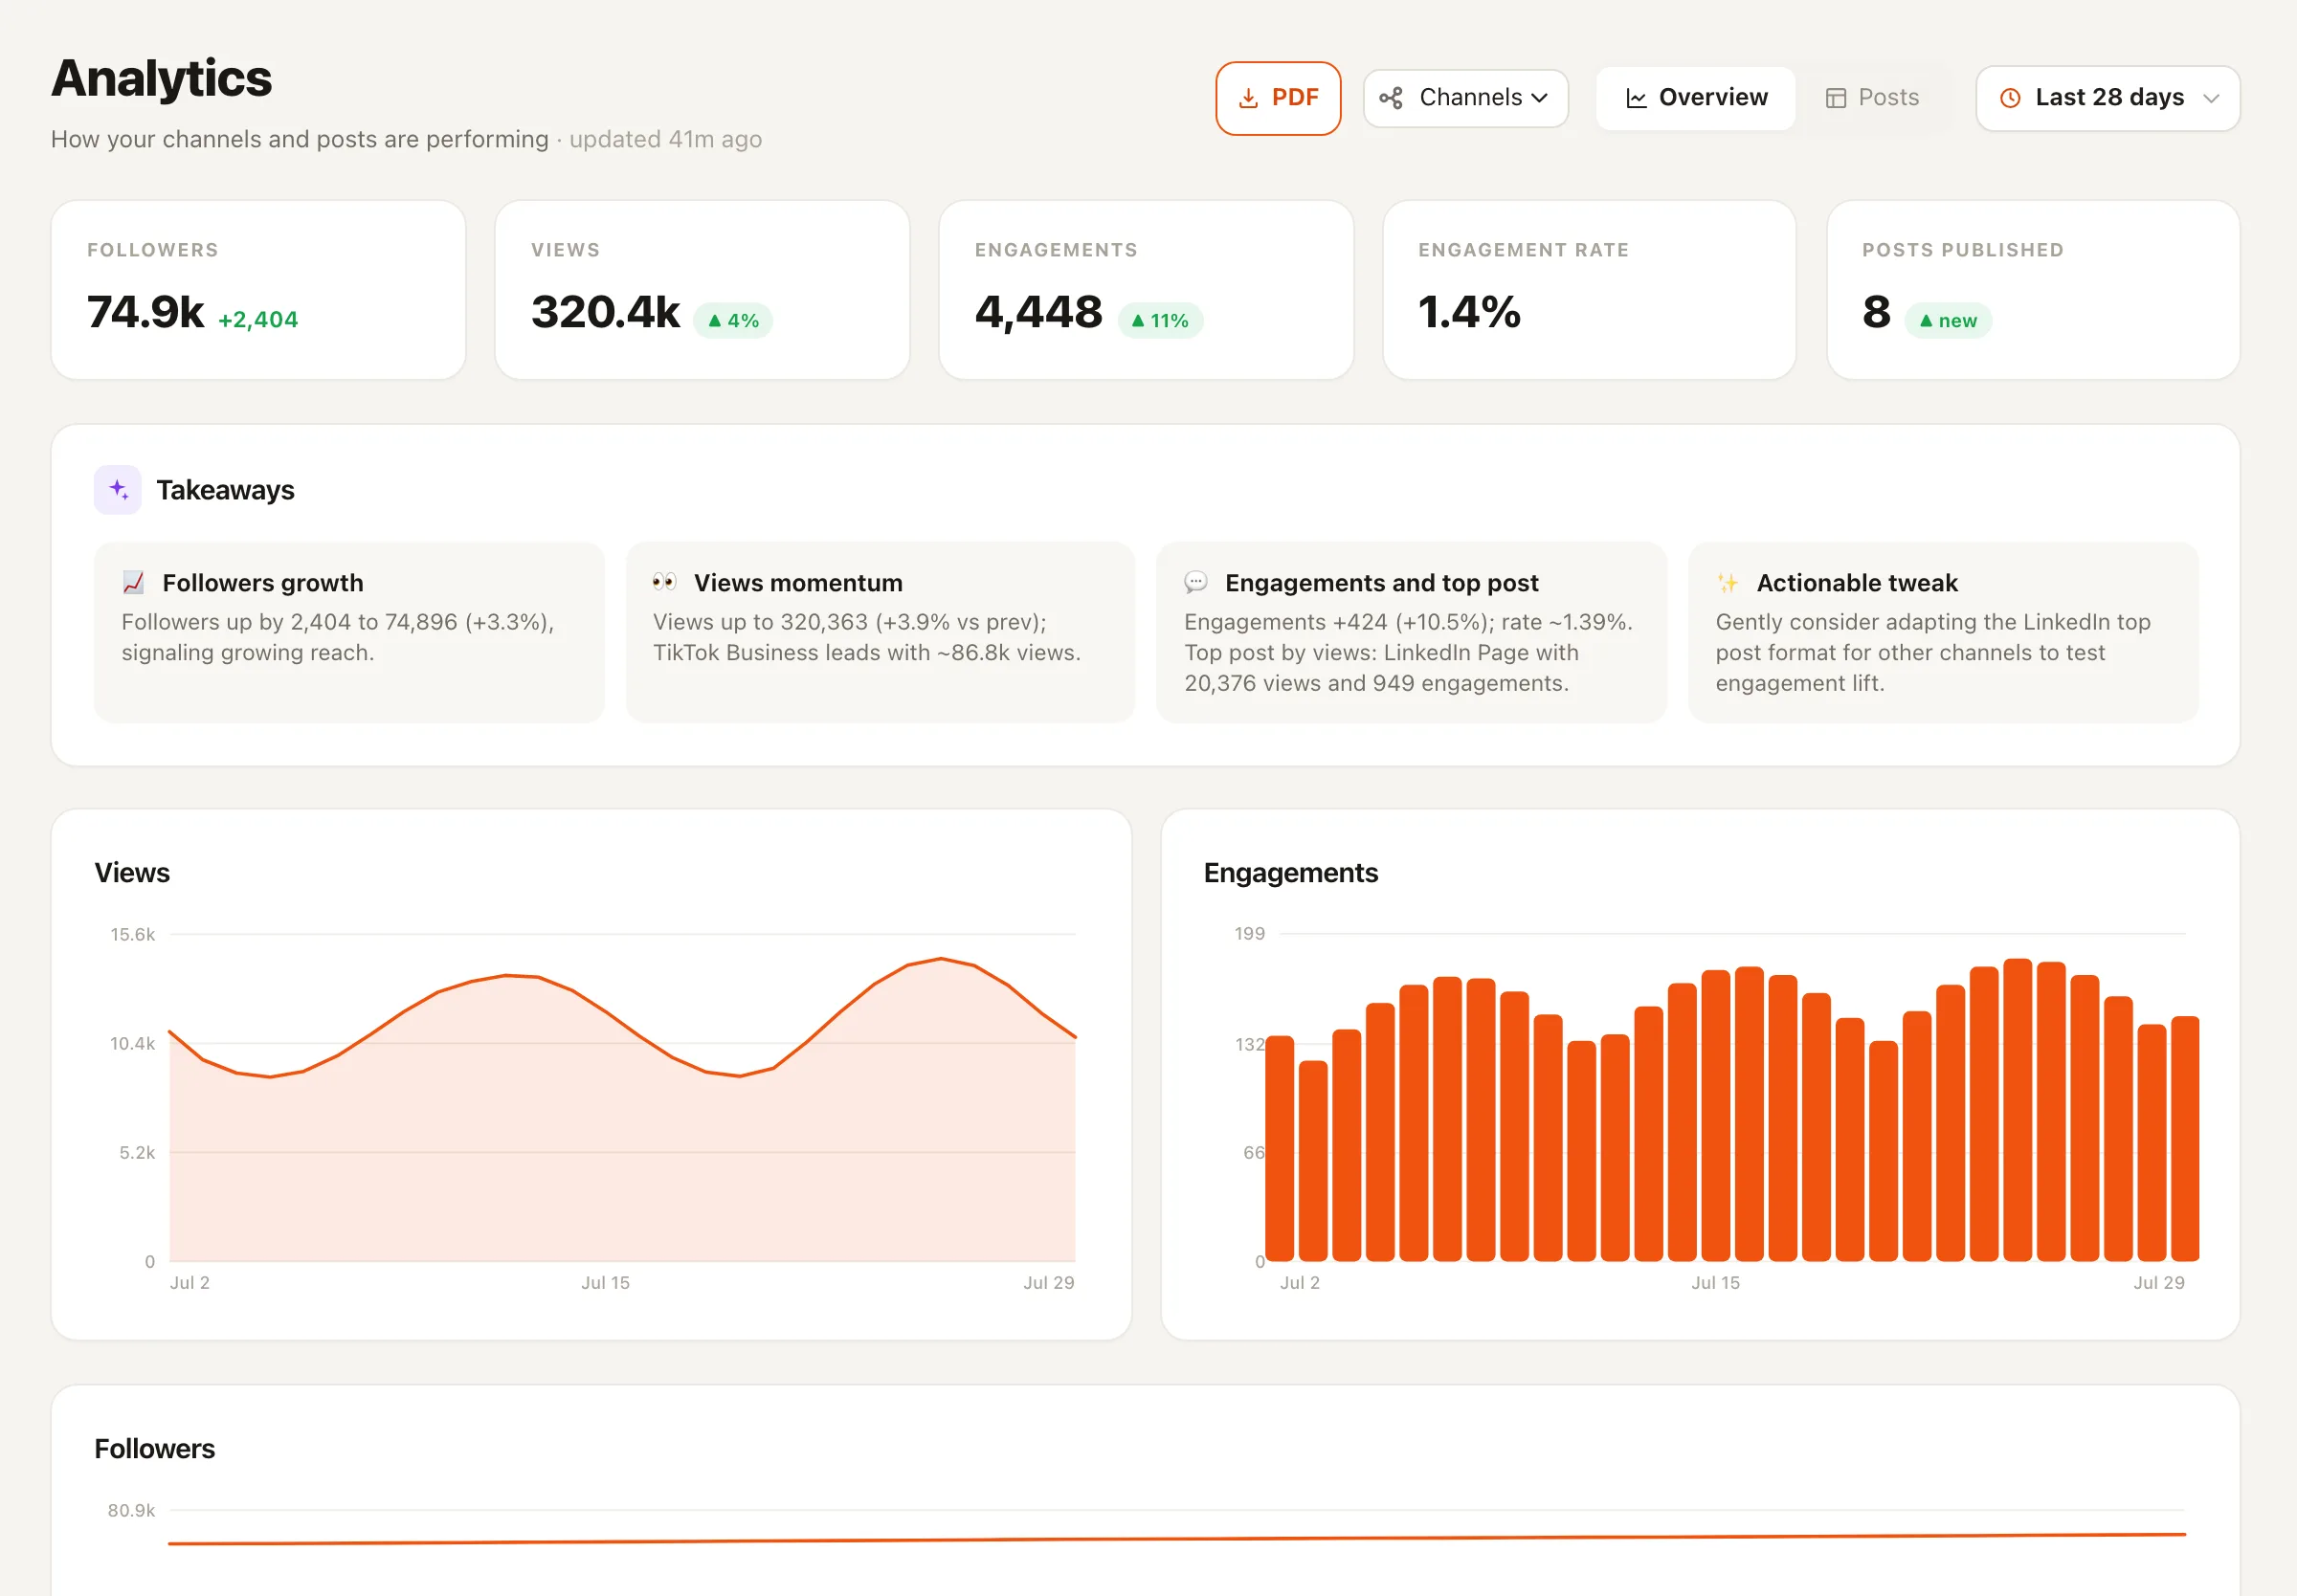
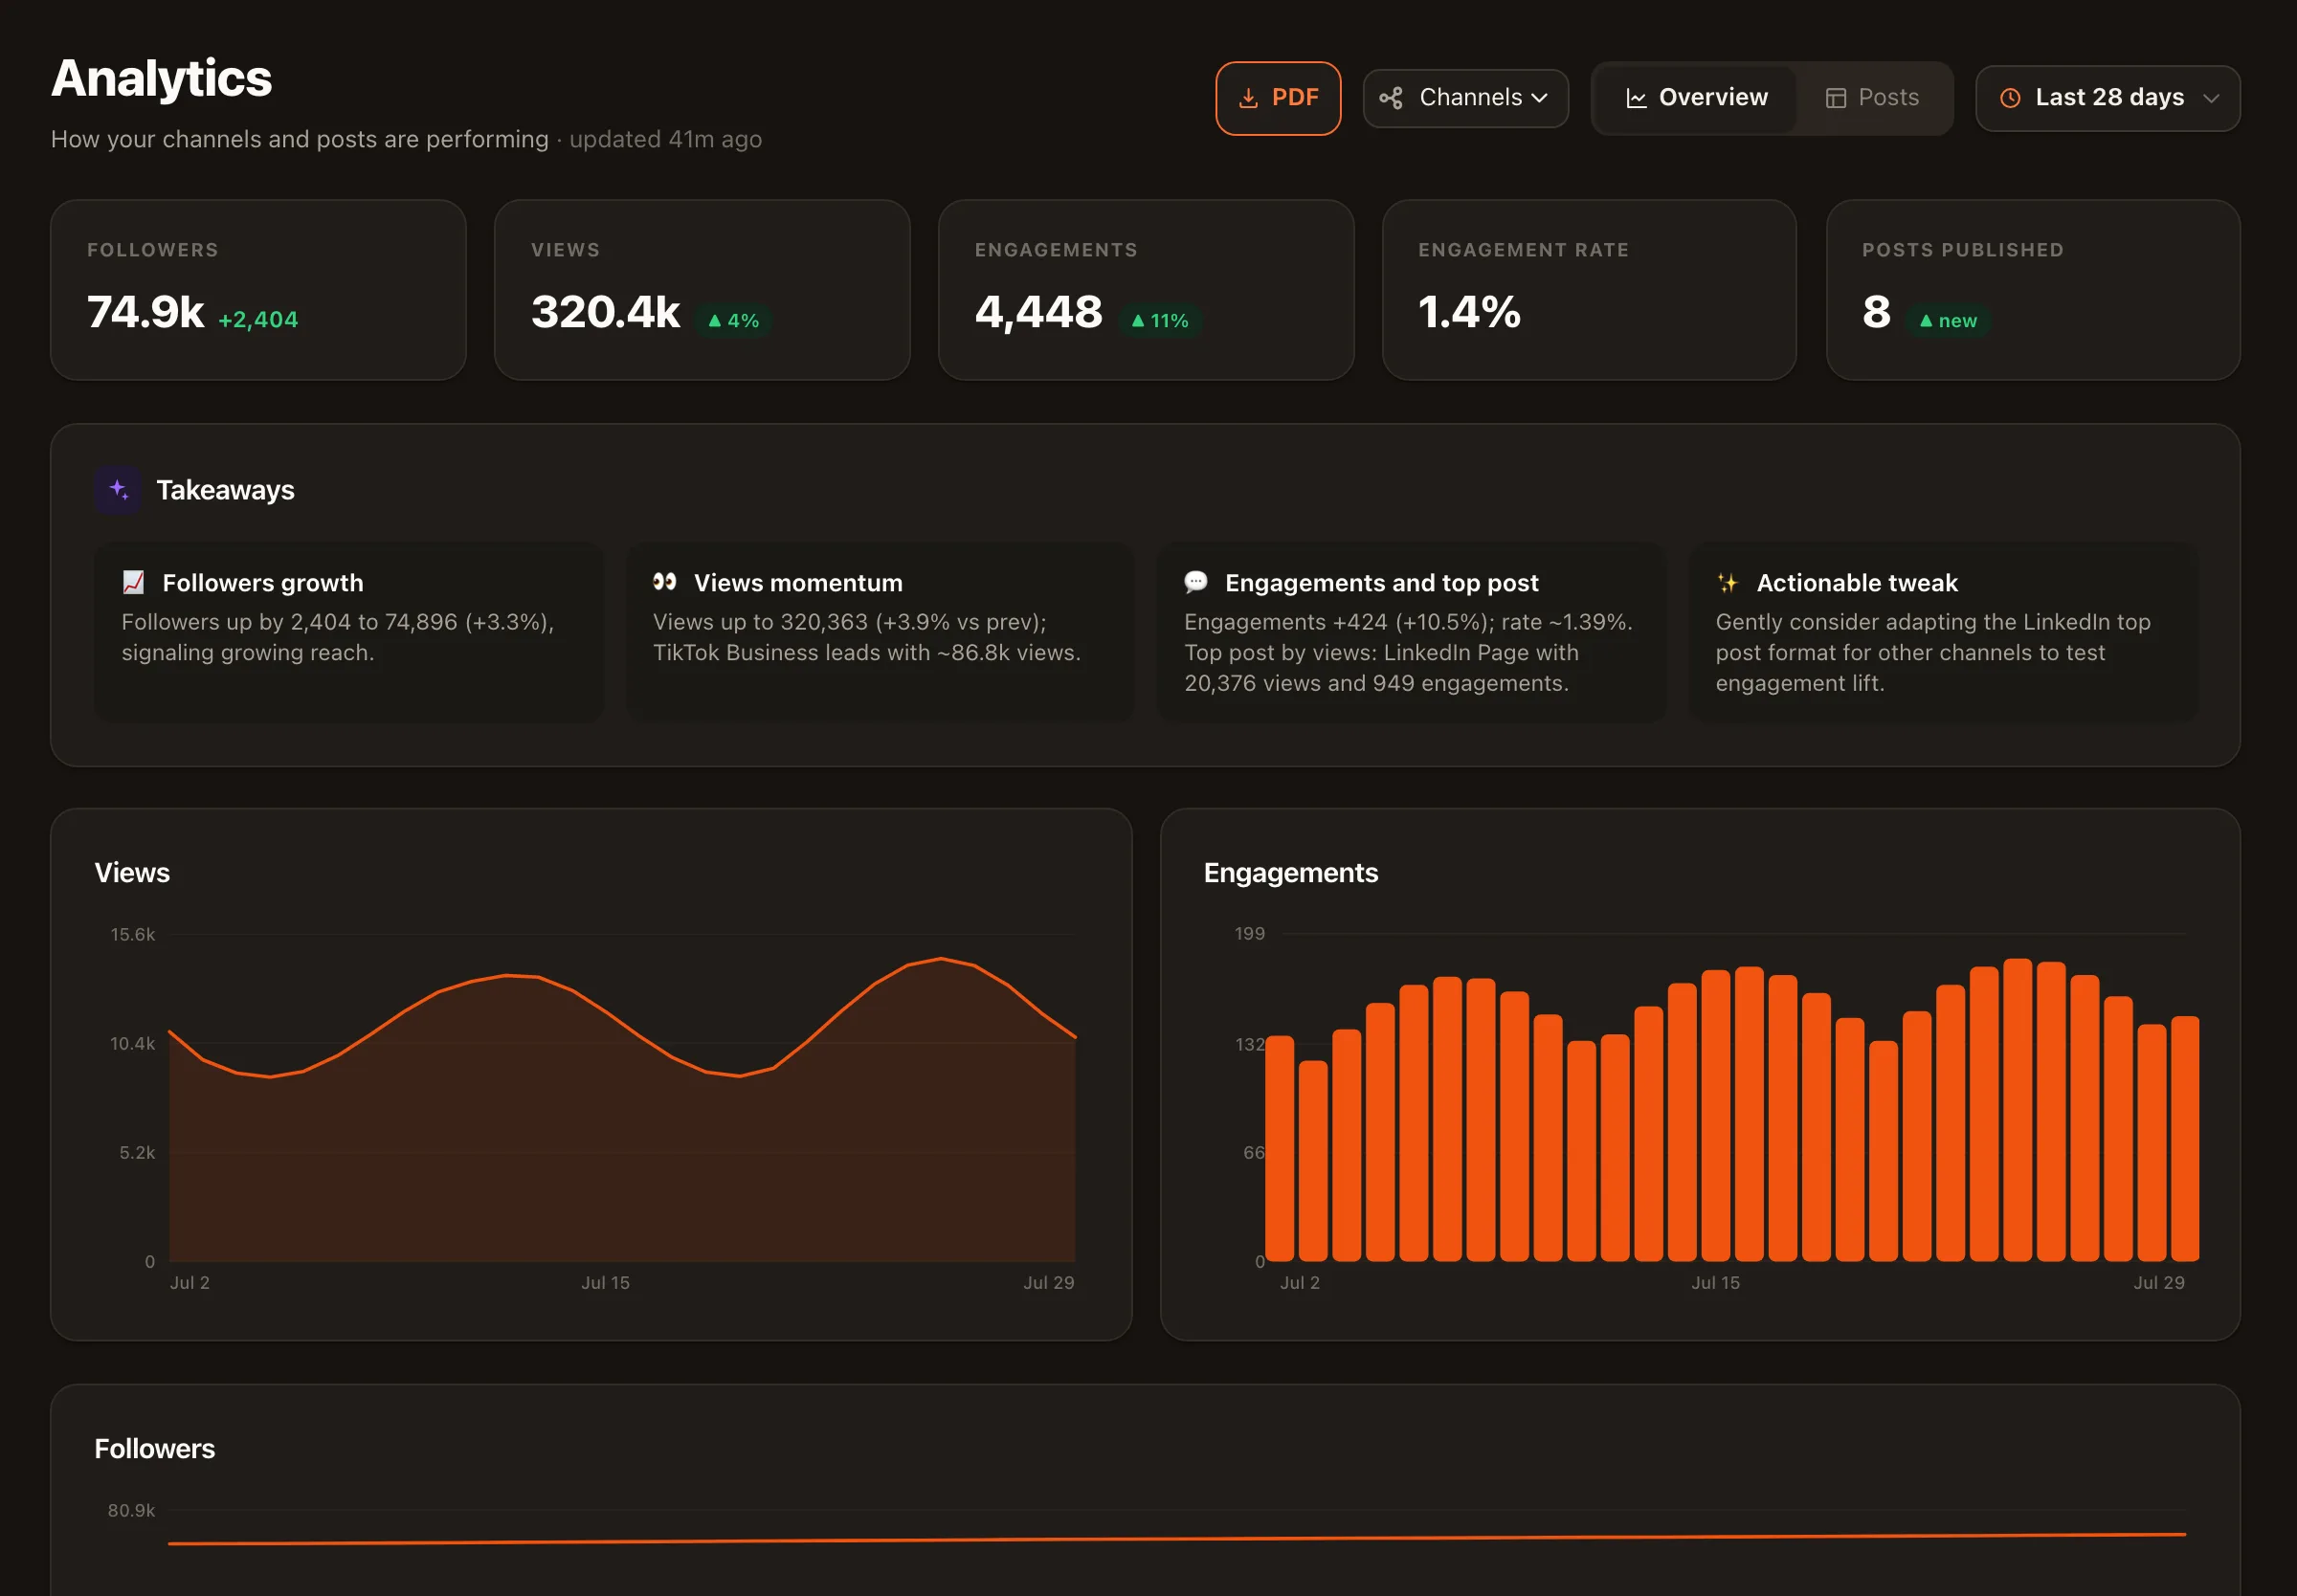
Nimply ingests daily performance snapshots from every connected channel — including a backfill of recent history where the platform allows it — and turns them into one clear picture.
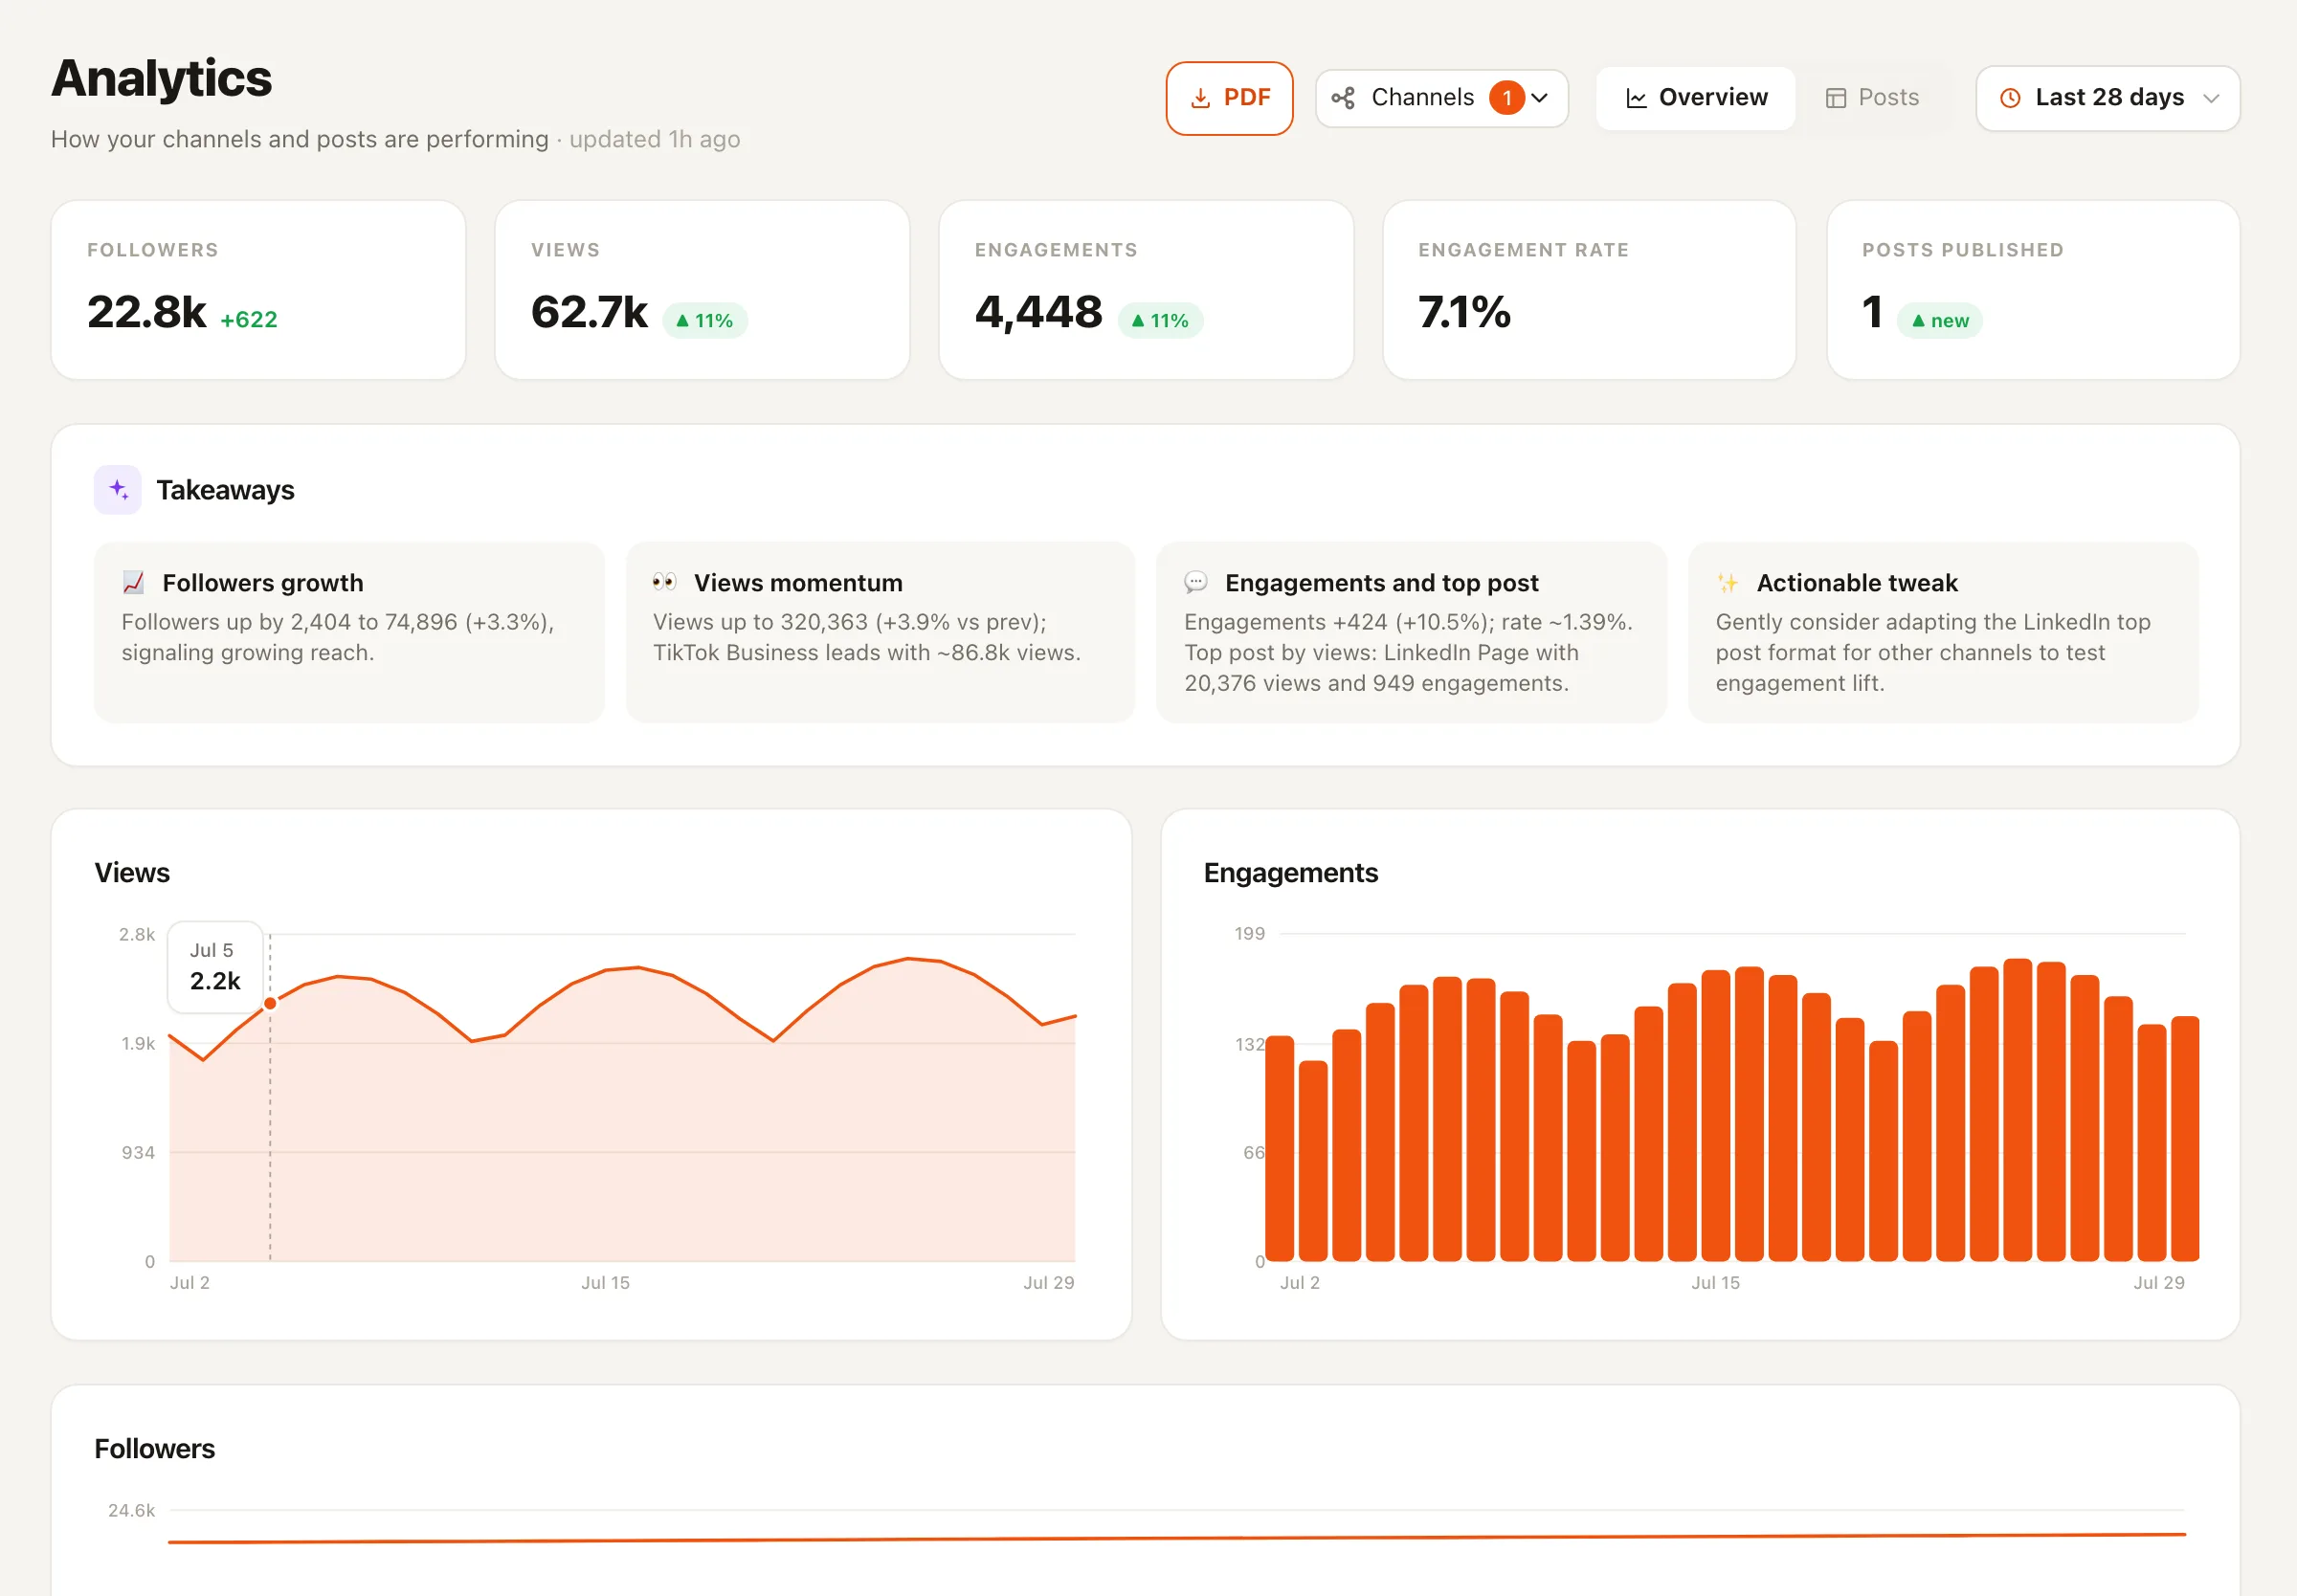
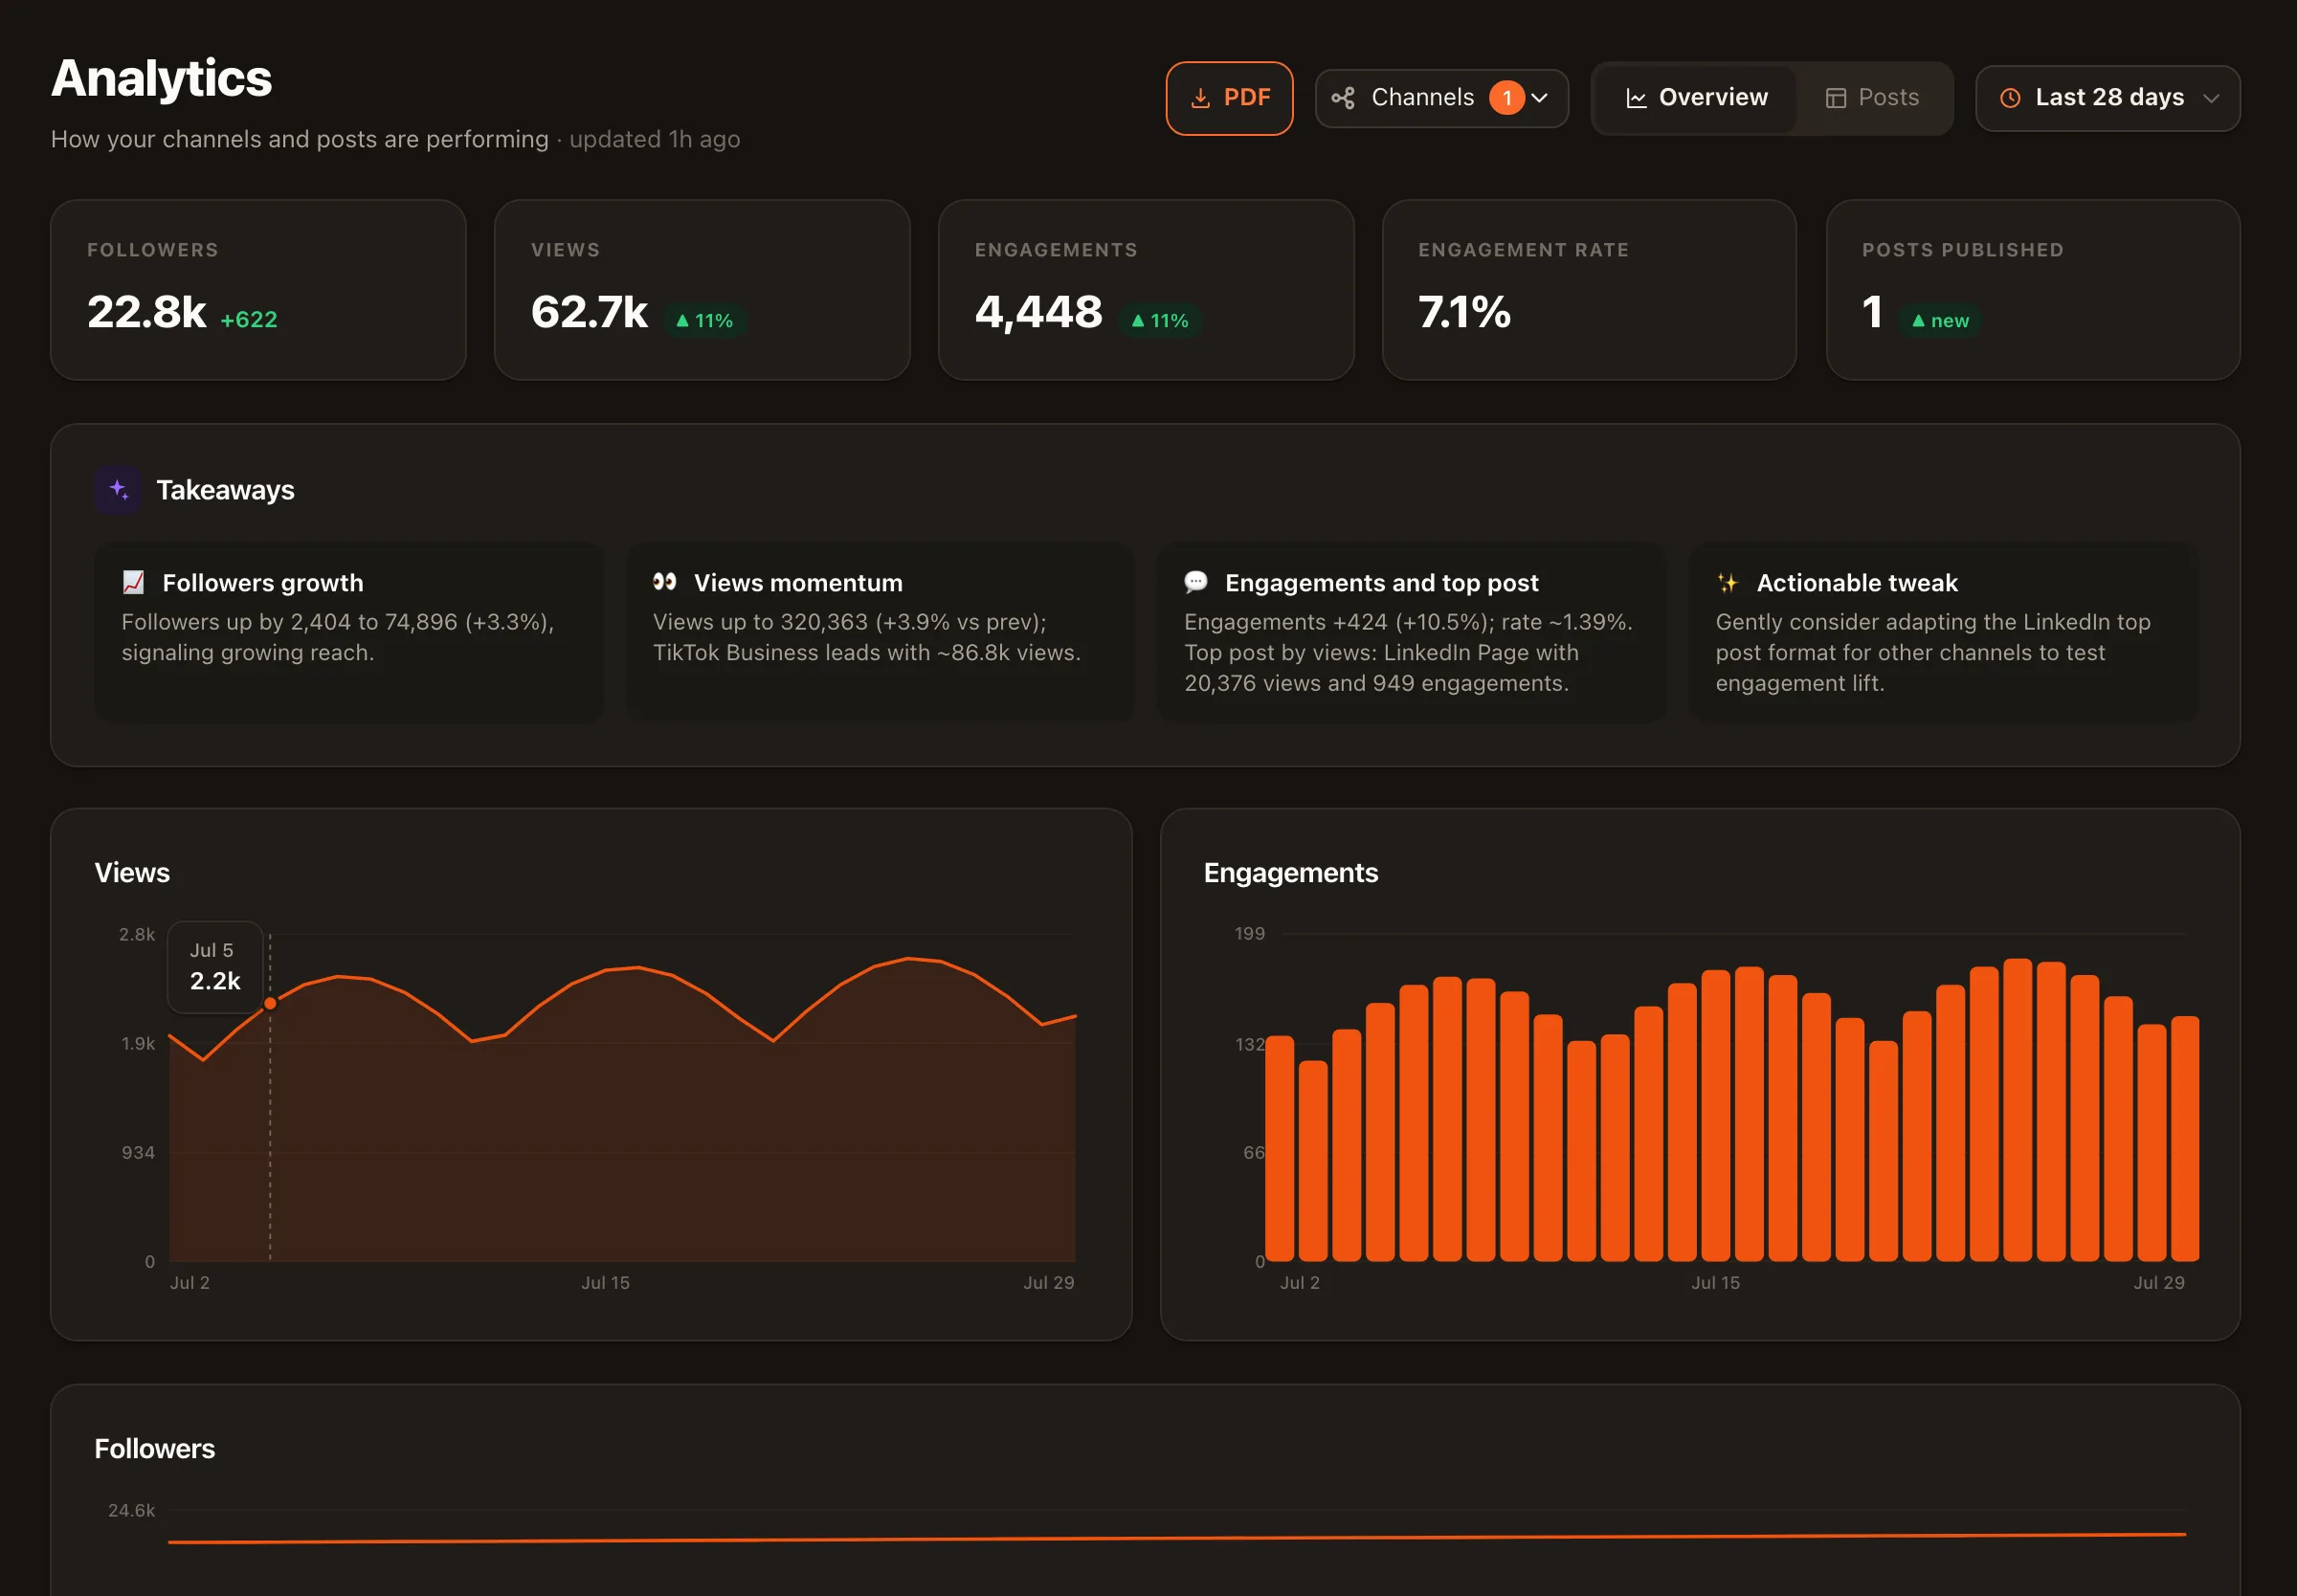
KPI tiles with real deltas
Followers, views, engagements, engagement rate, and posts published — each with its change versus the previous period, so trends are obvious at a glance.
Views & engagement charts
Daily performance snapshots from every connected channel, charted over 7-day, 28-day, or 90-day windows depending on your plan.
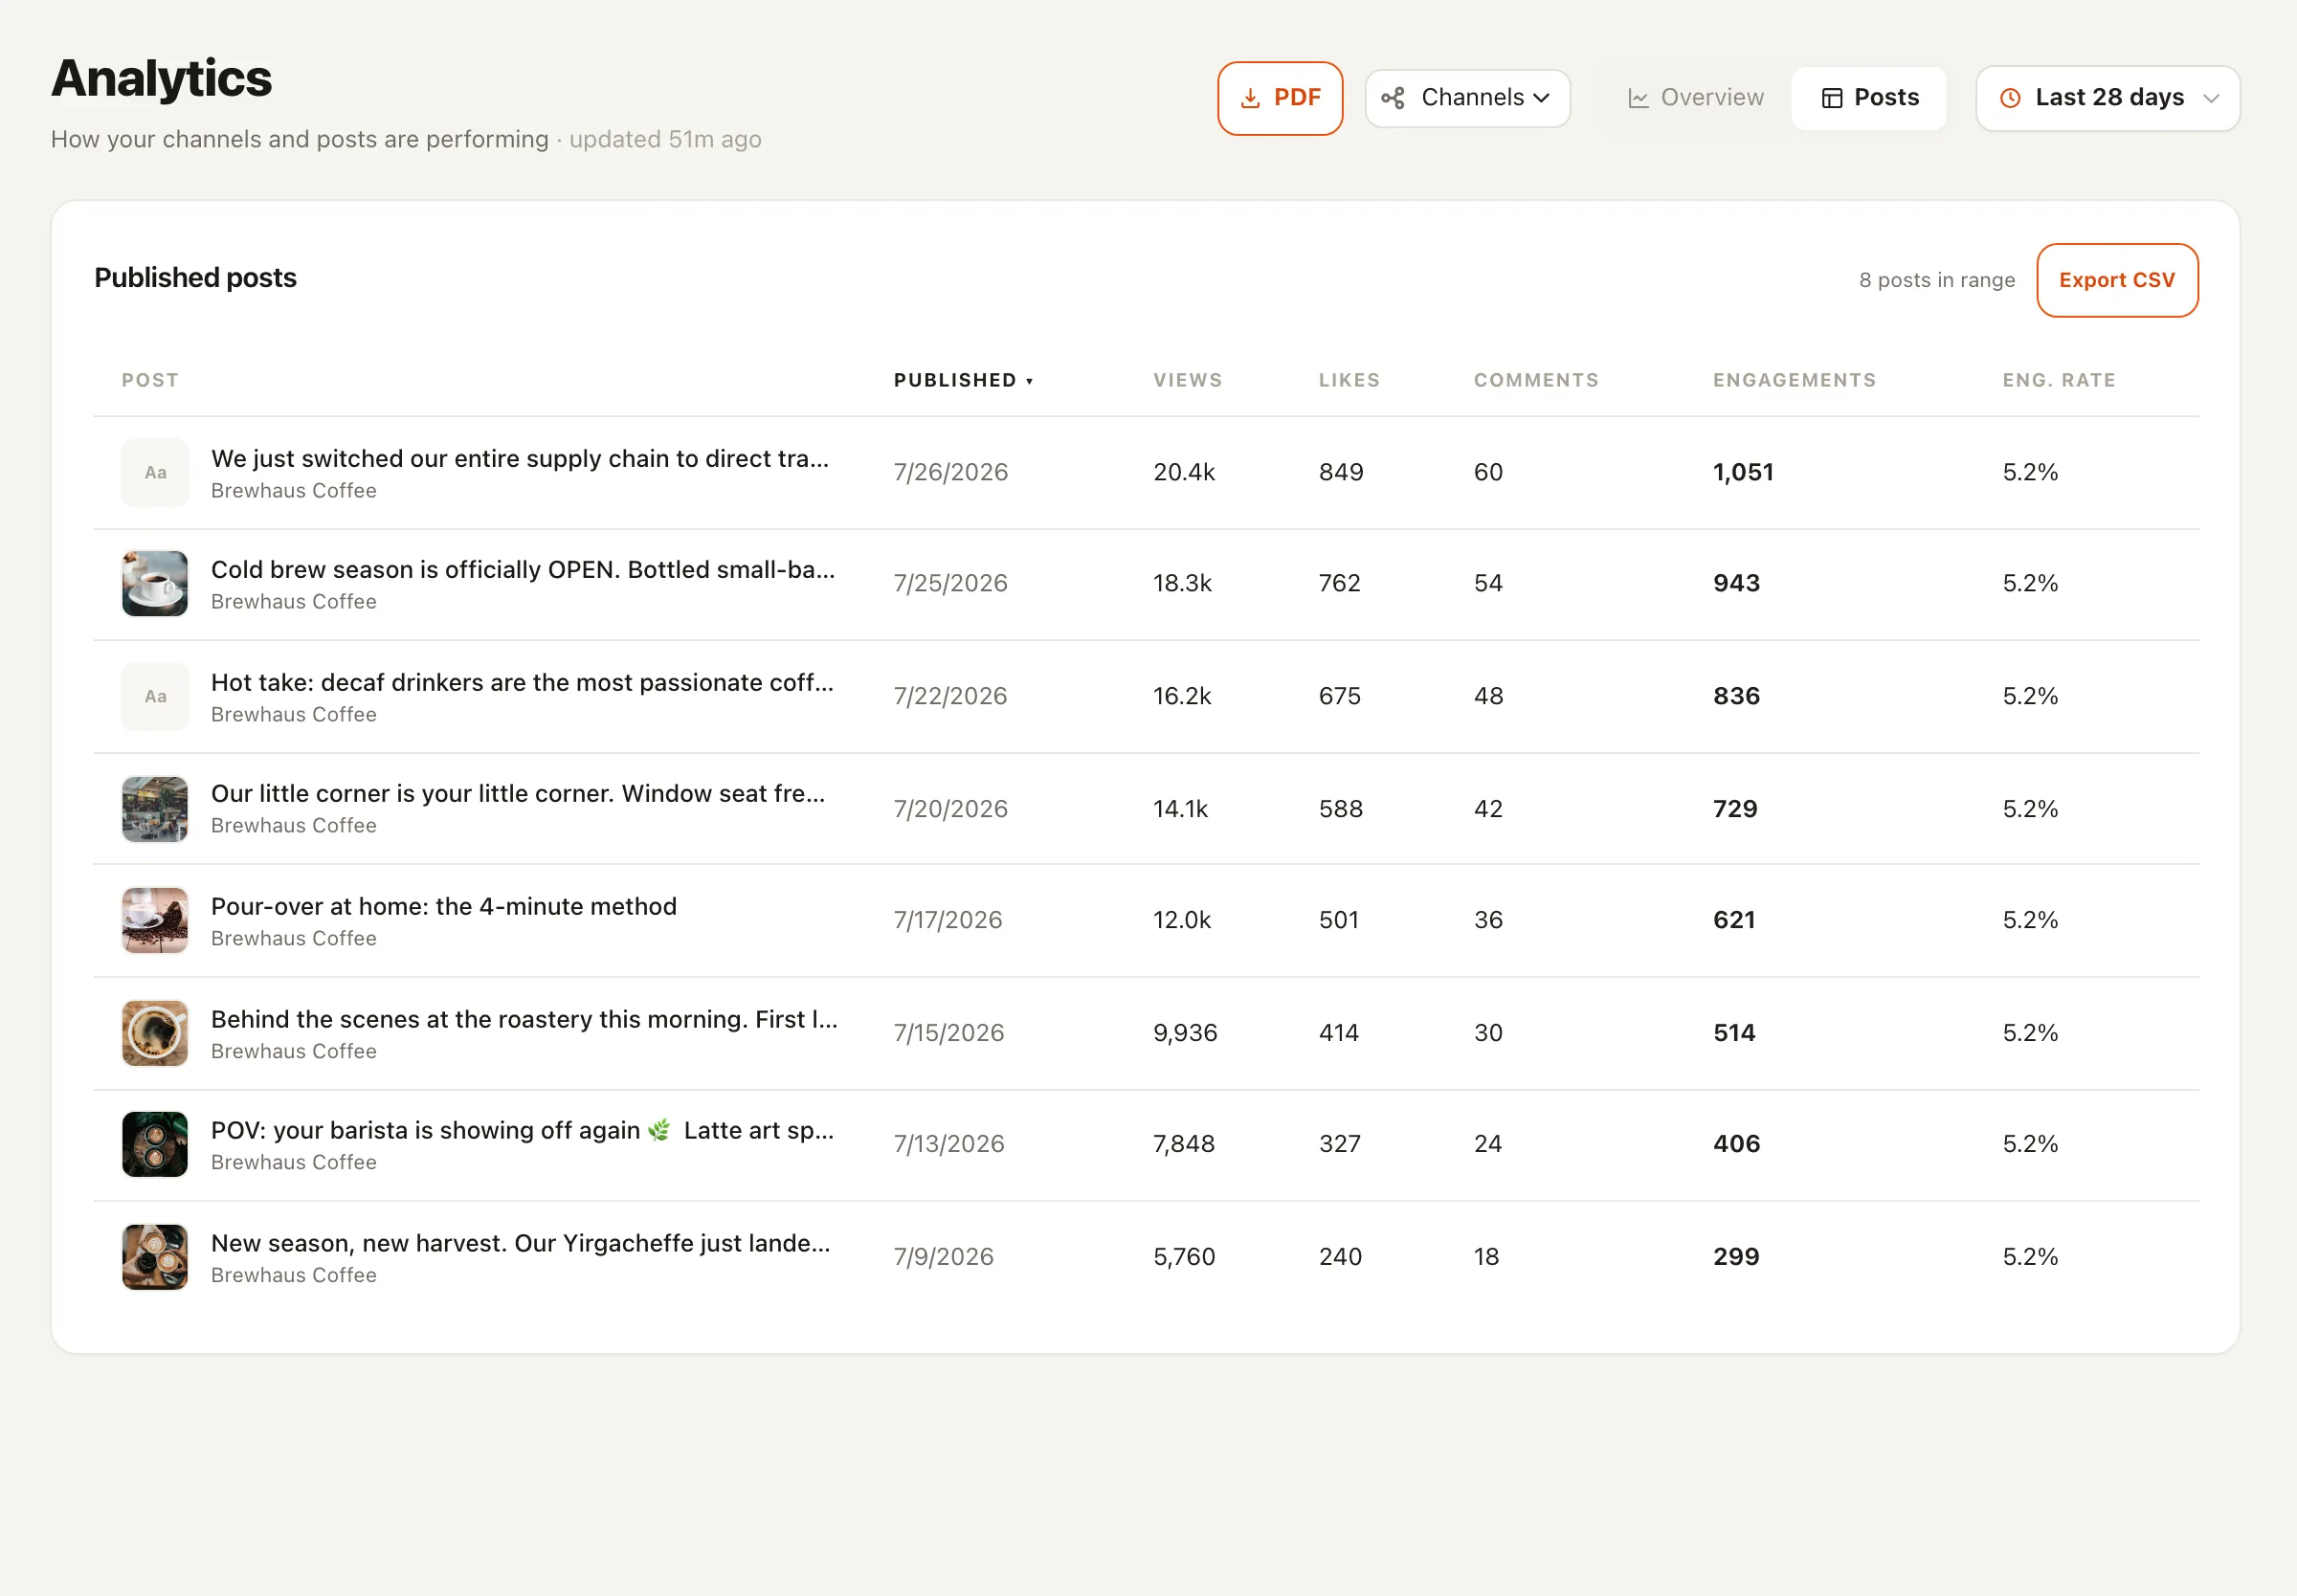
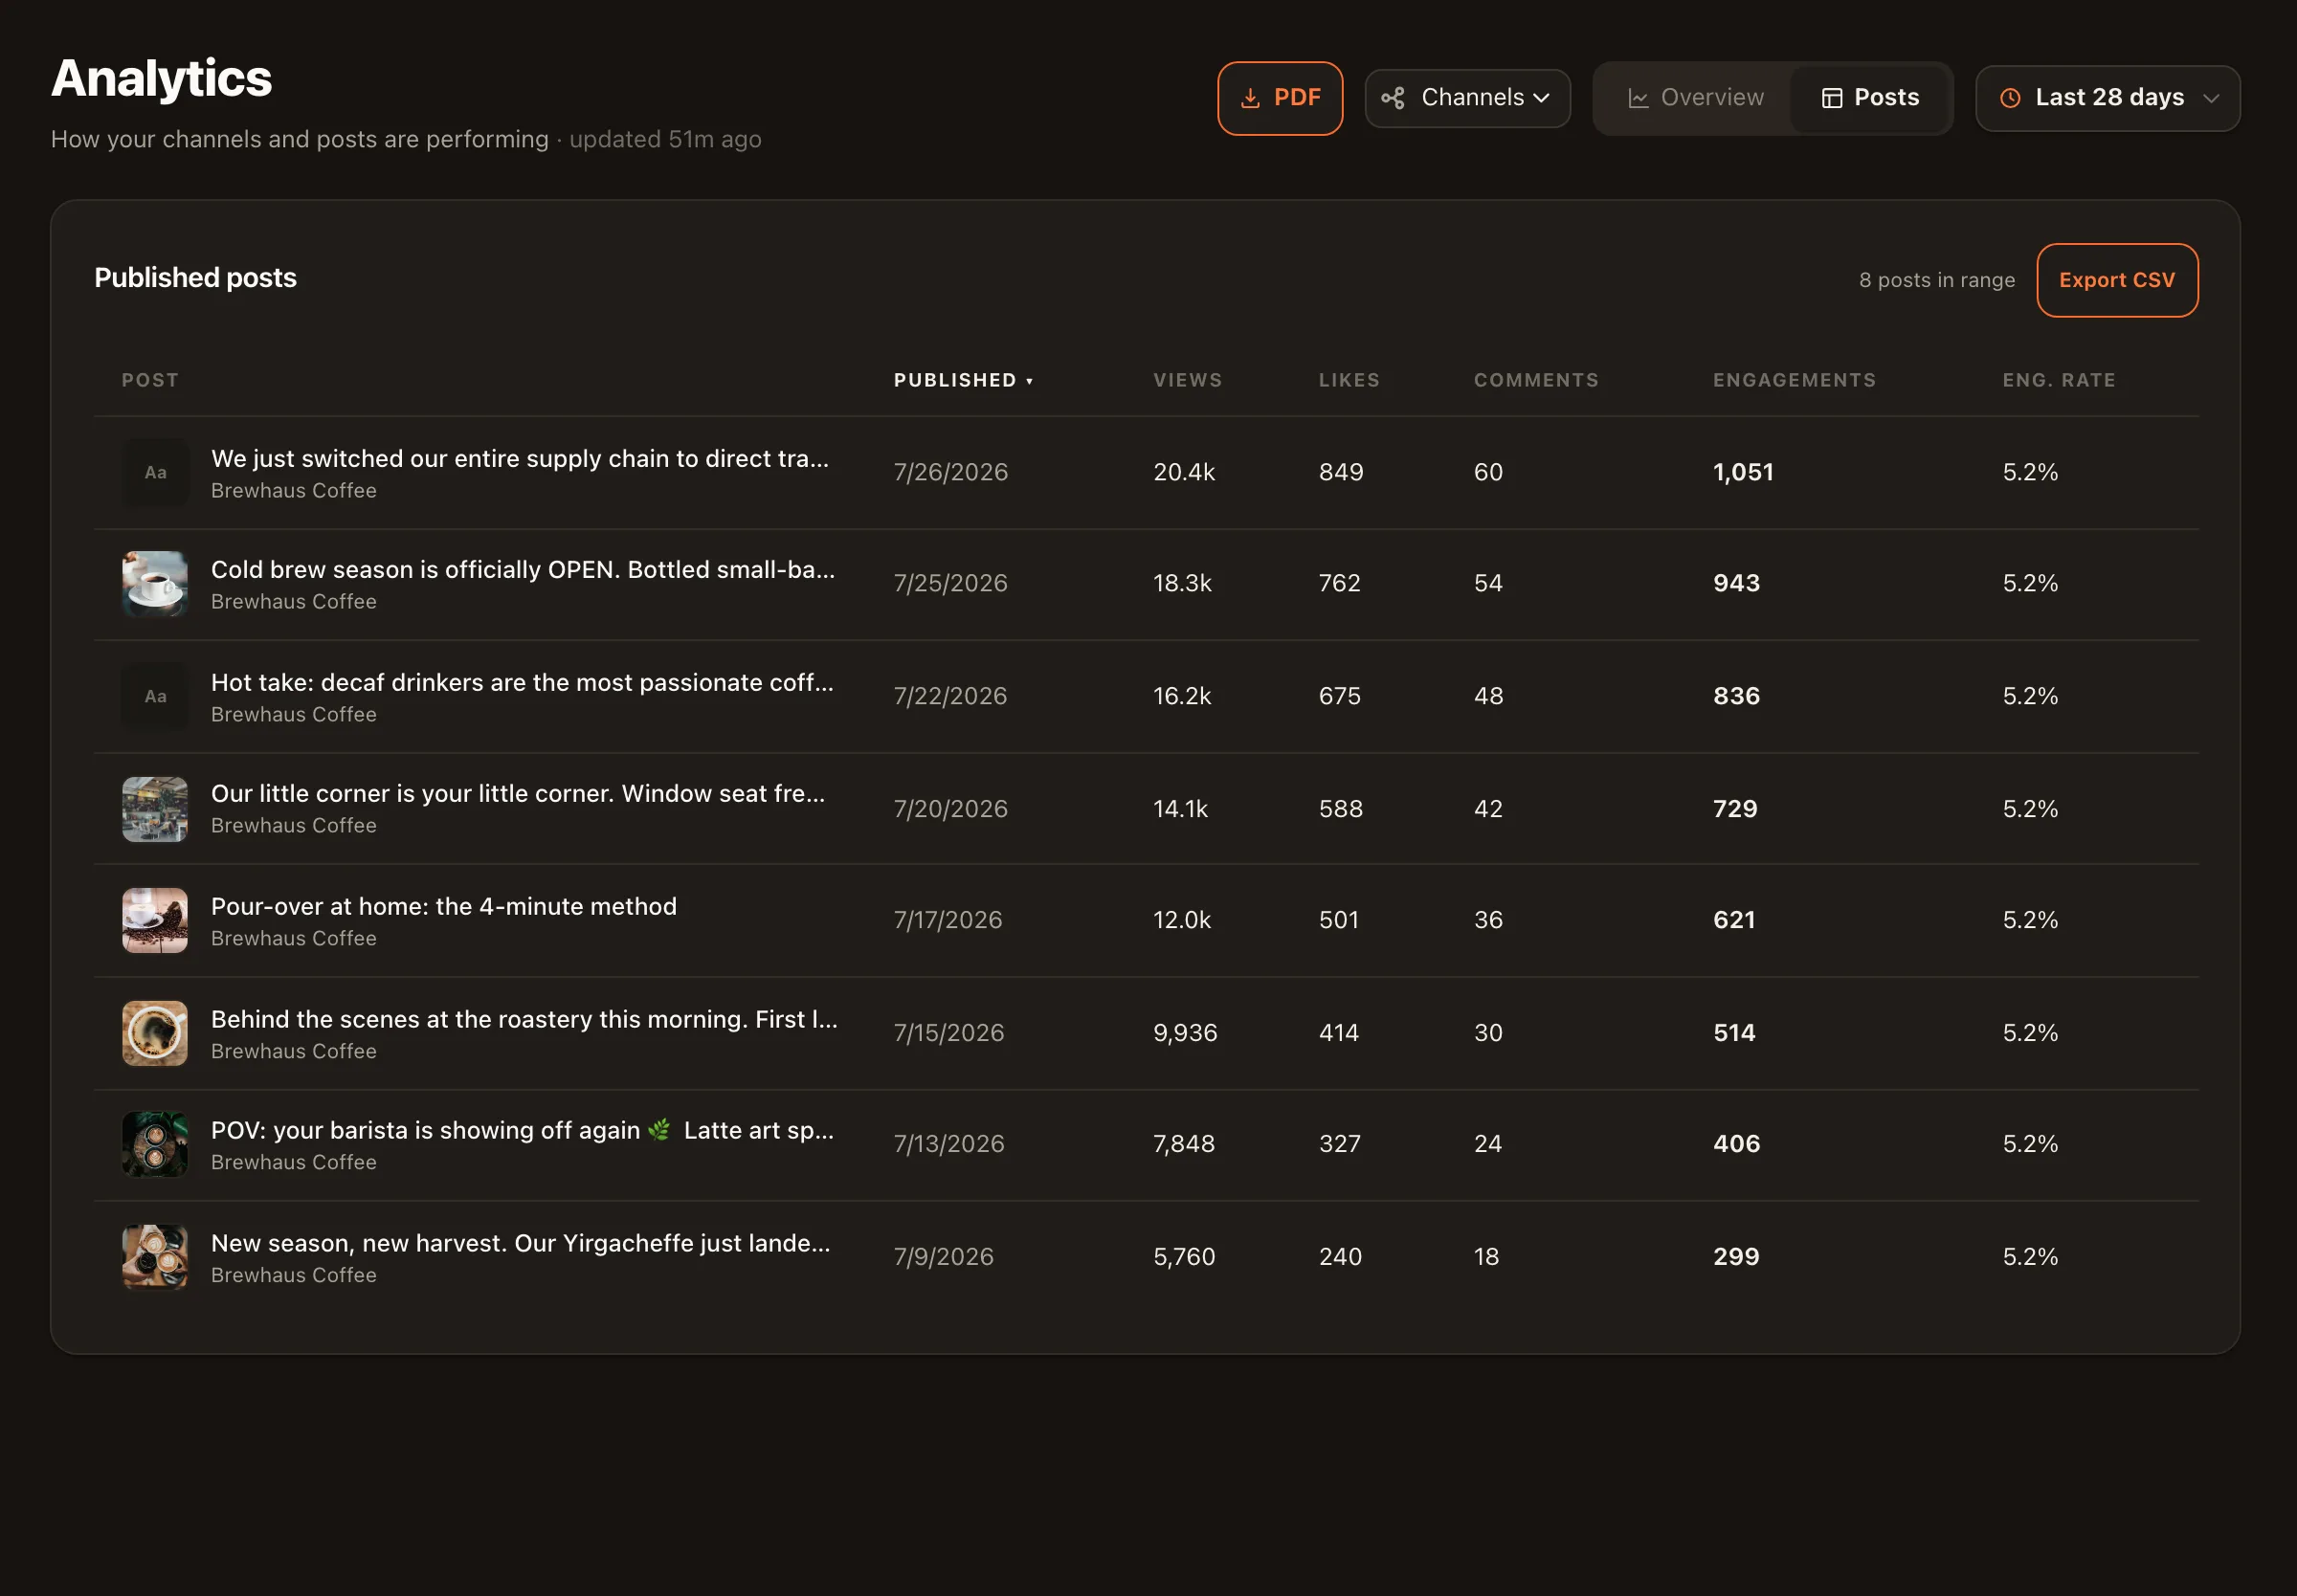
Sortable post table
Every published post with its metrics in one sortable table — plus a detail view per post and a link straight to it on the platform.
Per-channel deep dives
Drill from the cross-platform overview into a single channel to see exactly how one account is doing.
AI takeaways, included free
Short, plain-language takeaways generated from your actual numbers — what grew, what dipped, and what to try next.
CSV export
Need the raw numbers for a client report or your own spreadsheet? Export the post table to CSV whenever you like.
An honest word on metric depth
Platform APIs don’t all give the same data, and we won’t pretend otherwise. YouTube analytics are the deepest today — down to thumbnail impressions and click-through rate. Meta insights are live for Facebook Pages and Instagram professional accounts, X analytics are opt-in per channel because X bills every read, and LinkedIn analytics are coming soon. Metric depth also varies by account type; some platforms require a business or professional account.
Best time to post
Your best posting times, from your own audience
Most “best time to post” advice is a generic chart someone published years ago. Nimply builds a day-by-hour heatmap from how your published posts actually performed — because your audience isn’t an average.
Scored from your history
Day-and-hour windows are scored from your own posts' performance once you have enough history. Until then, research-based benchmarks fill in — and the source is always labeled, never blurred.
Shaded onto your planner
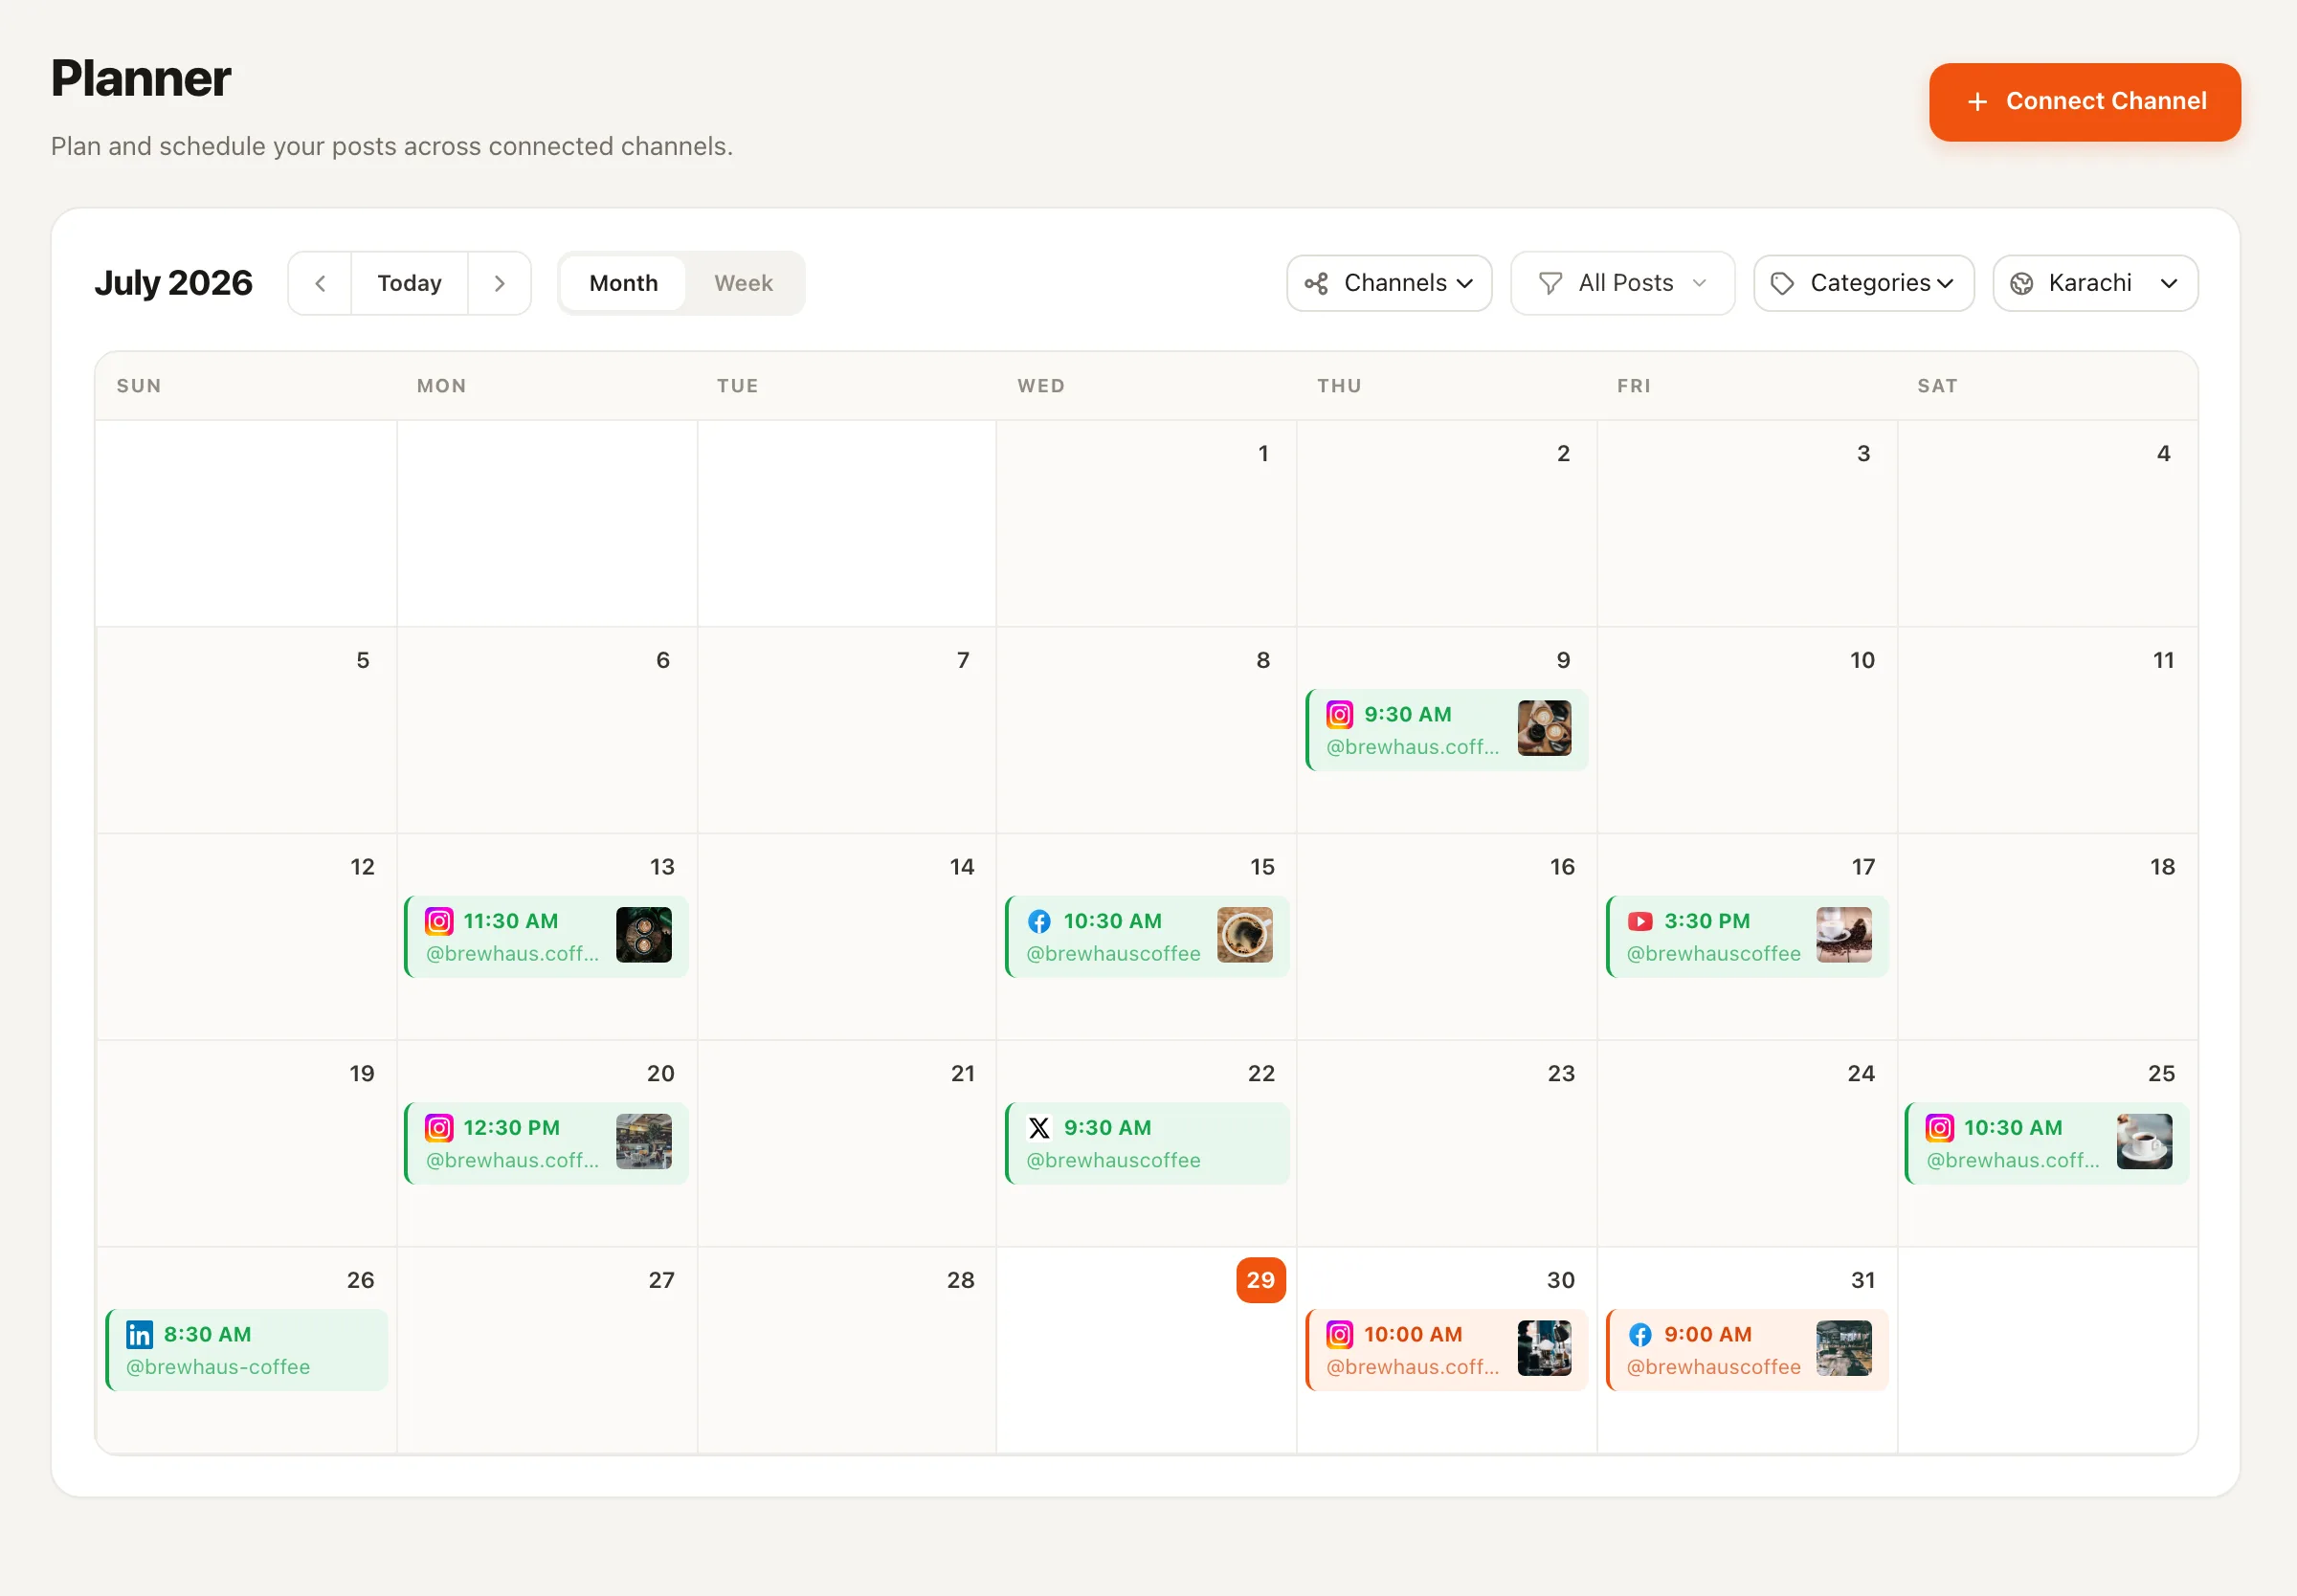
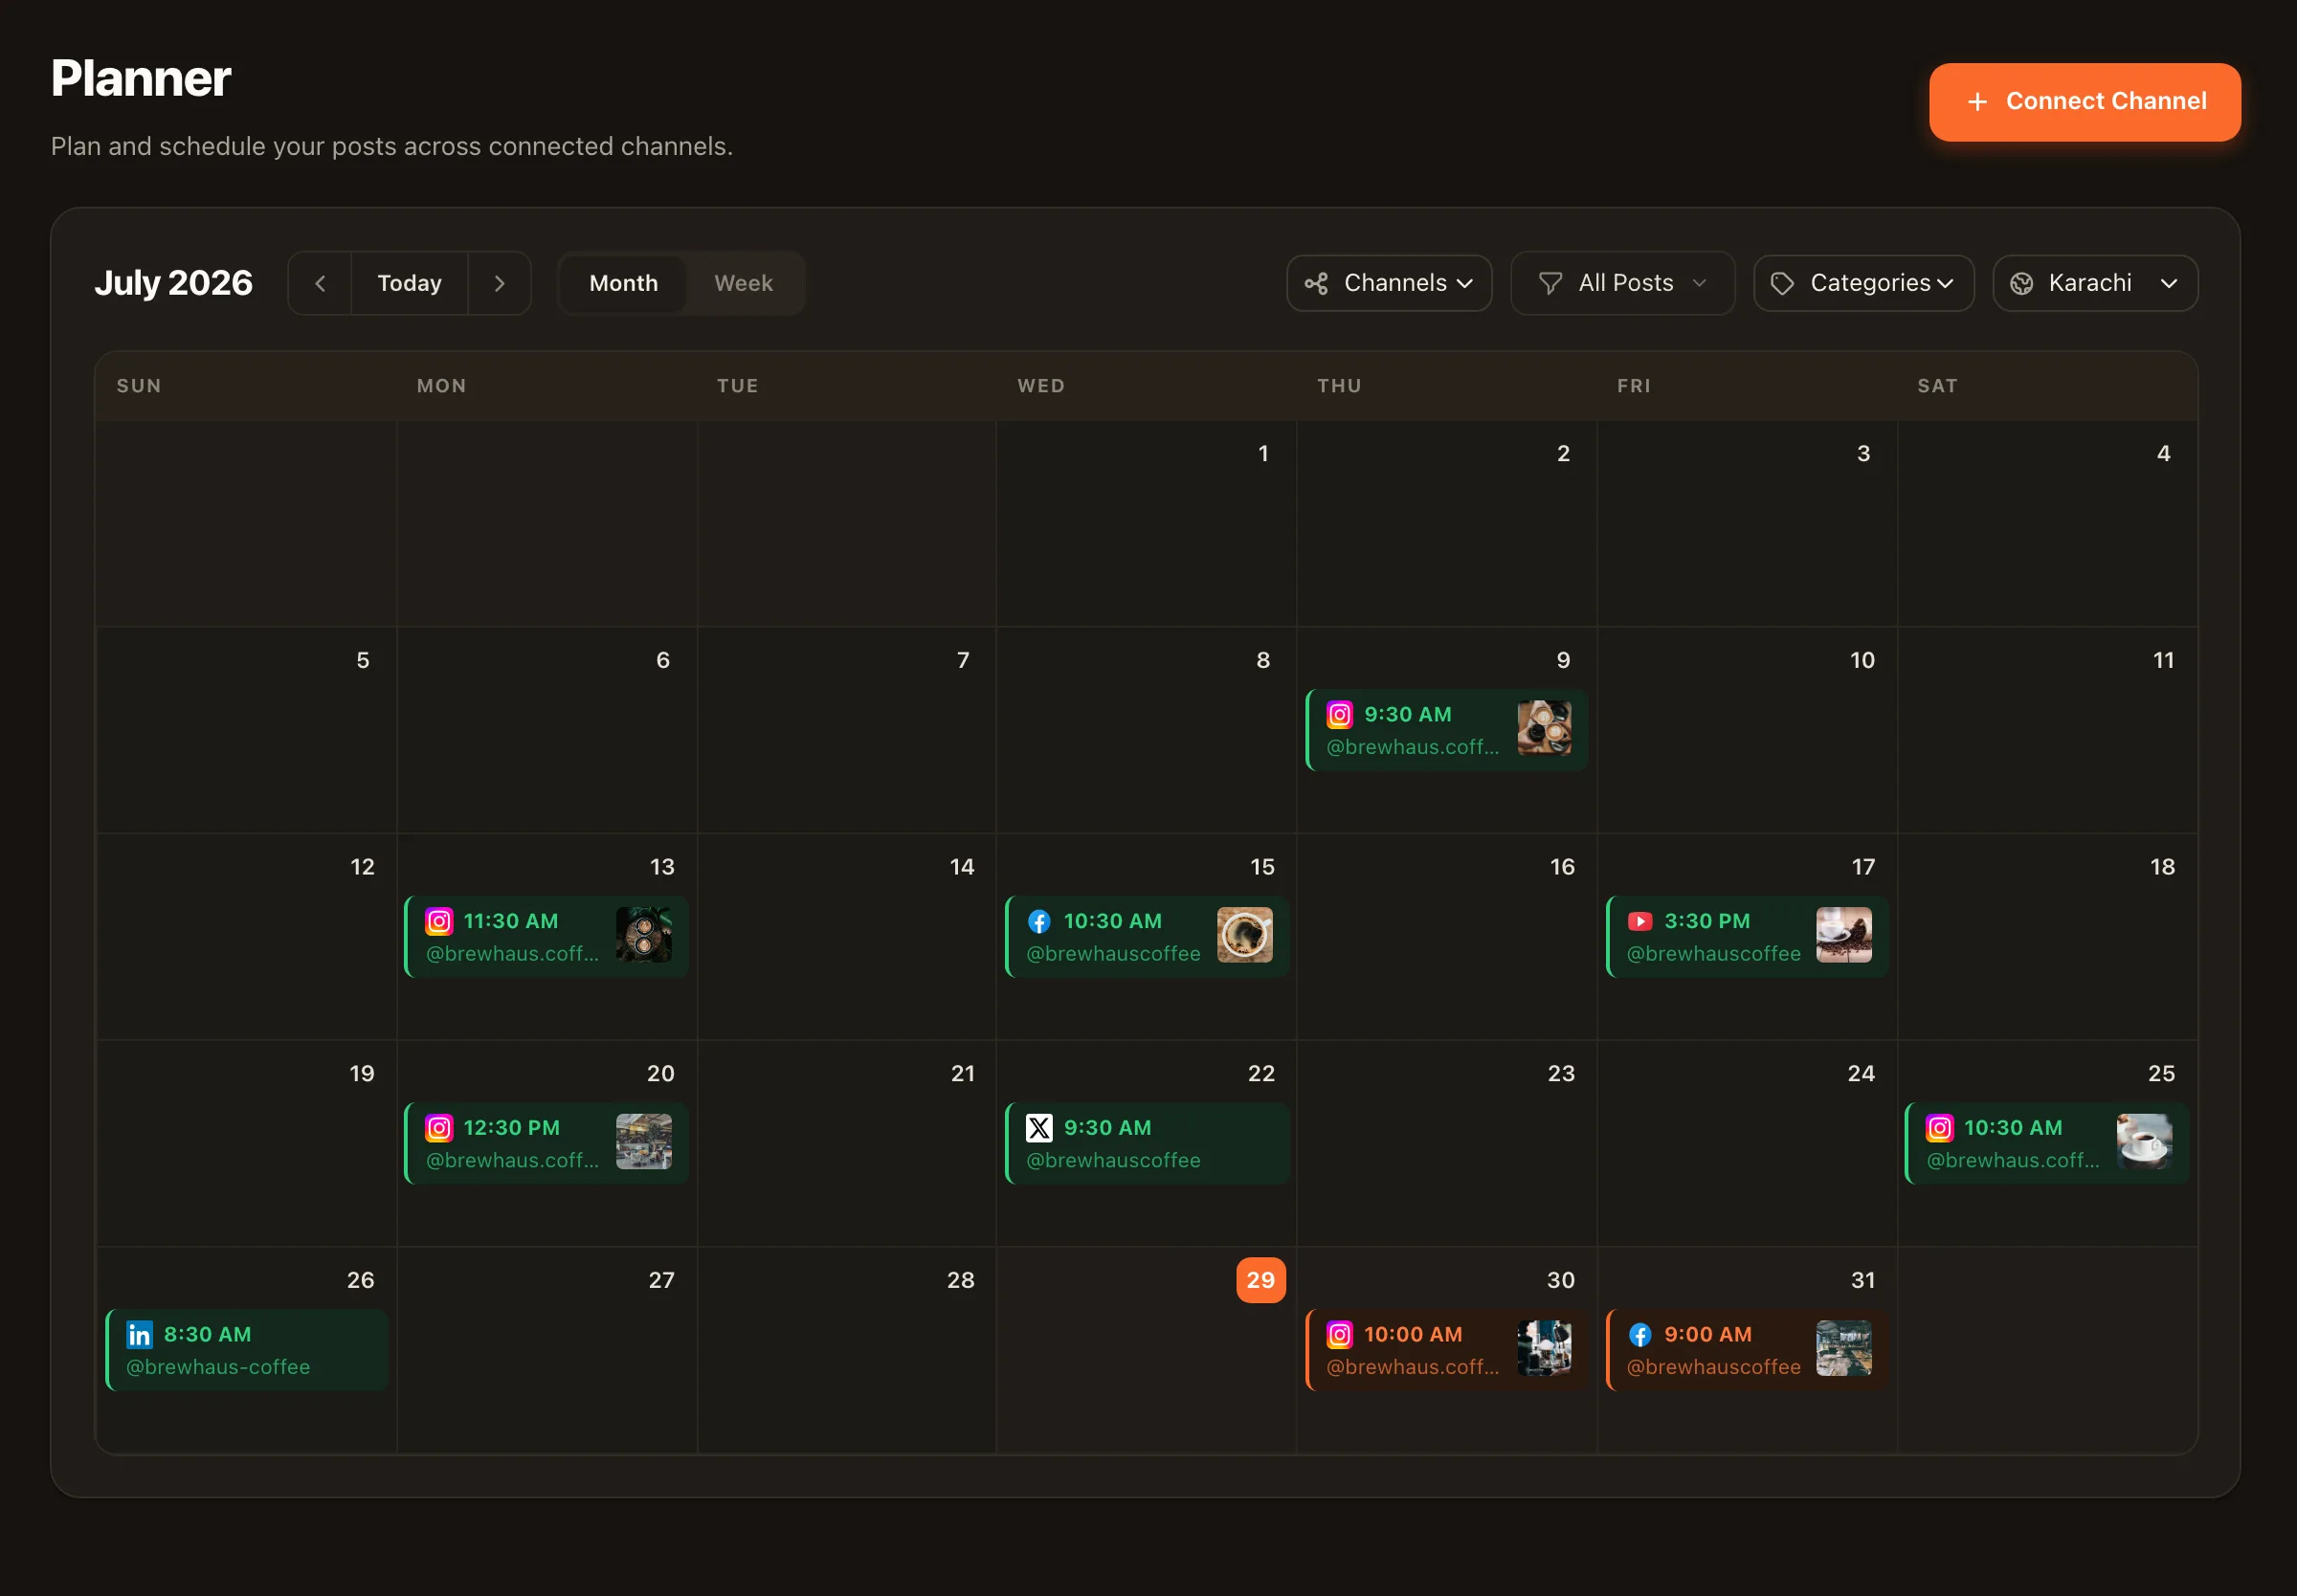
Your strongest windows shade the week view of the planning calendar, so the recommendation lives where you actually schedule.
One click from a scheduled post
Click a heatmap slot and the composer opens pre-set to that time. Insight to action, no copy-pasting timestamps.
The YouTube deep dive
YouTube analytics most tools don’t surface
Our deepest integration. The YouTube view goes beyond vanity metrics into the numbers that actually drive channel growth:
Watch time & views
The core signals YouTube's own algorithm cares about, tracked per period.
Subscriber change
Growth over time, with change versus the previous period.
Top videos
Which uploads carry the channel, so you know what to make more of.
Thumbnail impressions & CTR
How often thumbnails are shown and how often they earn the click — the metric most analytics tools skip entirely.
Where CTR data pays off
The same numbers verify your thumbnails
Nimply’s Thumbnail Director agent designs a new thumbnail, sets it on your video, and then uses this exact analytics pipeline to run a sequential before/after comparison on real impressions and click-through rate — so a “better” thumbnail is a measured claim, not a hunch.
Drill in
From the big picture to one channel, one post
The overview is where you start, not where you stop — filter down to a single channel or sort every published post by the metric you care about.
How it works
Connect once, decide with data forever
- 1
Connect your channels
Link your accounts once. Nimply starts collecting daily performance snapshots automatically, including a backfill of recent history where the platform allows it.
- 2
Publish as usual
Schedule and post normally — Nimply gathers post and profile metrics as your content goes live and keeps them updated.
- 3
Review, then act on it
Check the overview, read the AI takeaways, spot your best posts and times — then schedule next week into your strongest slots straight from the heatmap.
Free vs paid
The free plan gets the full dashboard
Free includes the complete analytics dashboard with the last 30 days of history and 7- or 28-day views. Paid plans unlock unlimited history and 90-day views.
And here’s the part people miss: Nimply keeps collecting your data from day one either way — so the moment you upgrade, your older history is already there waiting.
Social media analytics — frequently asked questions
Which platforms have analytics in Nimply?
YouTube, Instagram, Facebook, TikTok, Pinterest, Threads, and Telegram today, plus X as an opt-in per channel (X bills every read, so it draws AI credits) — YouTube is the deepest, including watch time and thumbnail click-through rate. LinkedIn analytics are coming soon. Metric depth varies by platform and account type; some platforms require a business or professional account.
Why are YouTube analytics deeper than the other platforms?
Platform APIs expose different amounts of data. YouTube's analytics API is the most generous, so Nimply can show watch time, subscriber change, top videos, and even thumbnail impressions and click-through rate. Richer Meta insights and per-post performance history arrive as platform reviews complete — the same roadmap honesty you'll find on our homepage.
How does best time to post work?
Nimply scores day-and-hour windows from your own published posts' performance once you have enough history, and falls back to research-based benchmarks until then — the source is always labeled so you know which one you're looking at. The strongest windows are shaded directly on your planning calendar, and clicking a heatmap slot opens the composer pre-set to that time.
Is analytics included in the free plan?
Yes. The free plan includes the full analytics dashboard with the last 30 days of history and 7- or 28-day views. Paid plans unlock unlimited history and 90-day views — and because Nimply keeps collecting data from day one, upgrading instantly reveals your older history.
Do analytics connect to scheduling?
Yes — that's the point. Analytics live beside the calendar and planner: best-time windows shade your week view, top posts show you what to repeat, and a heatmap slot is one click away from a scheduled post at that exact time.
Can I export my data?
Yes. The post-level performance table exports to CSV, so you can build client reports or run your own analysis on the raw numbers.
Stop guessing what worked
Connect your channels free — Nimply starts collecting daily snapshots immediately, and your best posting times show up right on the calendar.