

All 10 pages
 Page 1
 Page 2
 Page 3
 Page 4
 Page 5
 Page 6
 Page 7
 Page 8
 Page 9
 Page 10
Presentation template
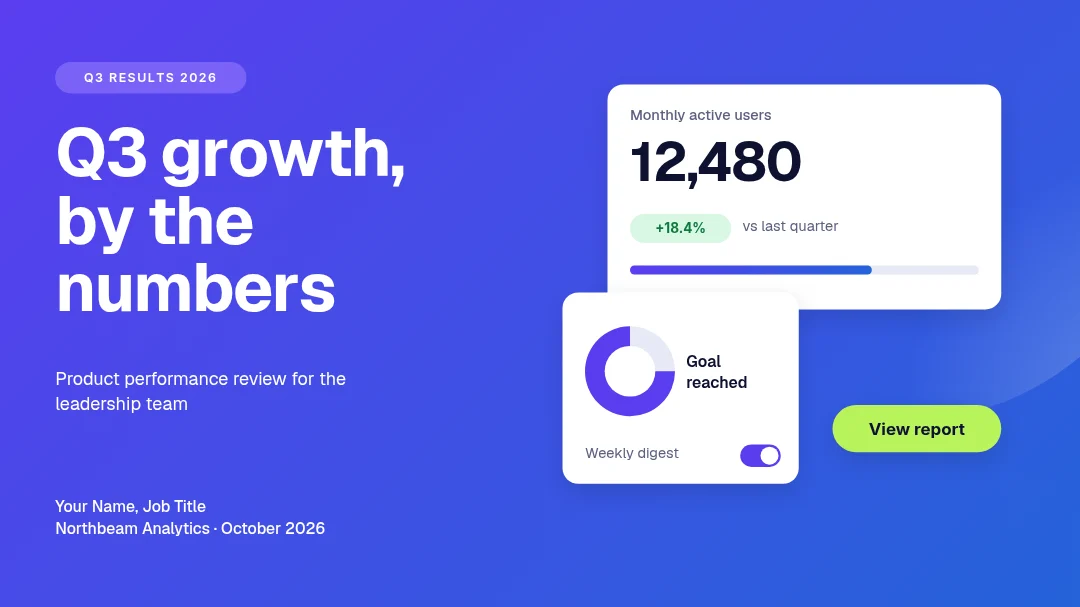
Violet Dashboard Results Deck
Presentation slide (16:9) · 1,920 × 1,080 px · 10 pages
A ten-slide stats and results deck for a SaaS team, built from bold colour blocks, floating UI cards, chips, toggles and progress bars.
Free to edit in your browser. Sign in and it opens in the Nimply editor as your own copy.

By Nimply Studio
The Nimply design team. Templates are made by the team and by Nimply's design agents, then reviewed before they are published.
- Size
- Presentation slide (16:9), 1,920 × 1,080 px
- Pages
- 10 pages
- You can edit
- 129 text boxes, 1 photo, colours and fonts
- Fonts
- Geist, Inter
- Colours
- #5b6180#ffffff#0e1230#5a3df0#f4f5fb#2563d9
- Text on it
- “Q3 growth, by the numbers” · “12,480” · “Agenda”
Make it on brand
Apply your brand kit's colours and fonts to every page in one click, and swap in your own photos and logo.
Resize it
Copy & resize makes versions for other platforms, like a story or a LinkedIn post, from the same design.
Post it
Download PNG, JPG, WebP, PDF or SVG, or send it straight into a post for approval and scheduling.
Similar presentation templates
 1/8
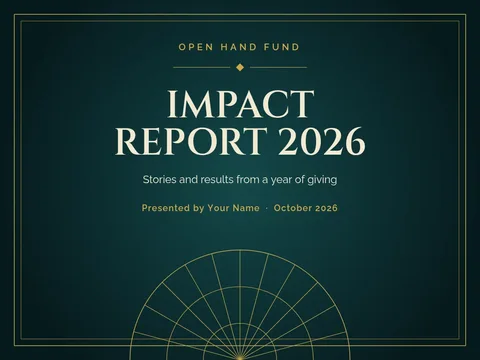
Gilded Fan Impact Report
Presentation
 1/10
Tailfin Atomic Launch Deck
Presentation
 1/6
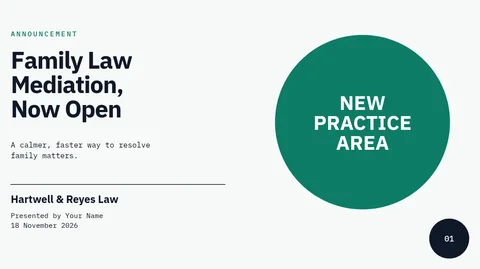
Ring Chart Announcement Deck
Presentation
 1/7
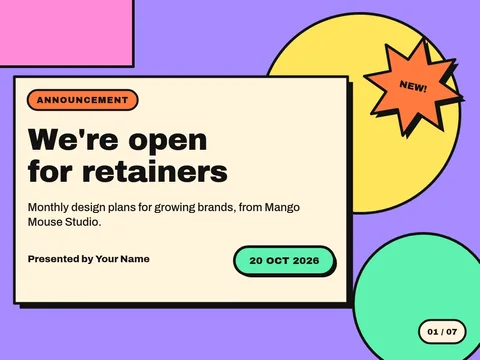
Neo-Brutalist Announcement Deck
Presentation
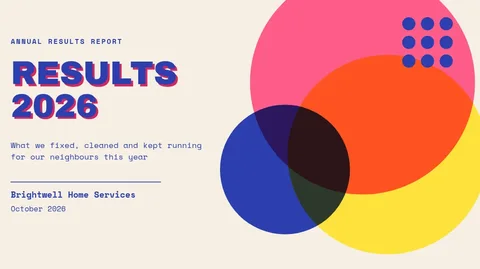 1/10
Triple Ink Results Deck
Presentation
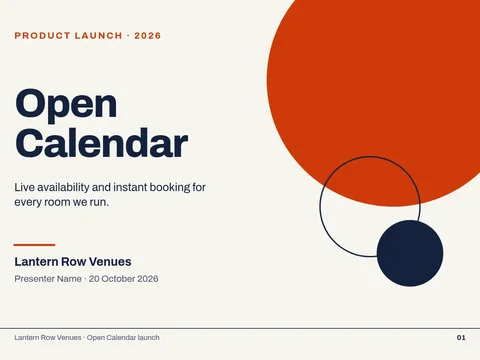 1/7
Ember Ring Launch Data Deck
Presentation
 1/8
Sage Line Launch Deck
Presentation
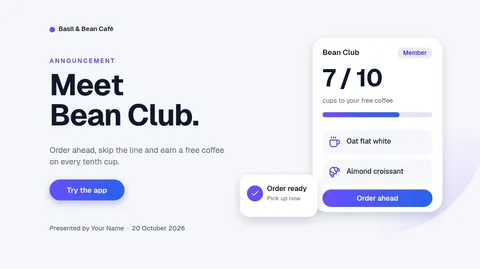 1/9
Bean Club Product Launch Deck
Presentation
 1/6
Alder Moss Blob Hiring Deck
Presentation
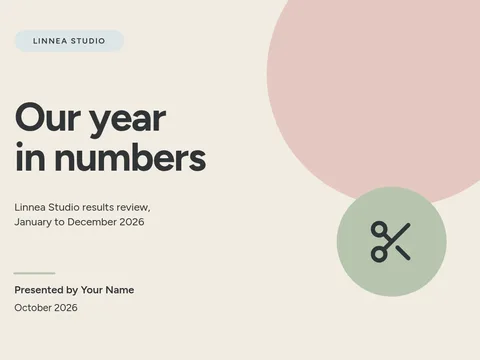 1/7
Nordic Soft Results Deck
Presentation
 1/8
Brass Mat Speaker Launch Deck
Presentation
 1/6
Signal Wave Season Announcement Deck
Presentation
Design it, approve it, schedule it
Nimply Design sits inside the tool that publishes your posts, so a finished graphic goes straight into the calendar.